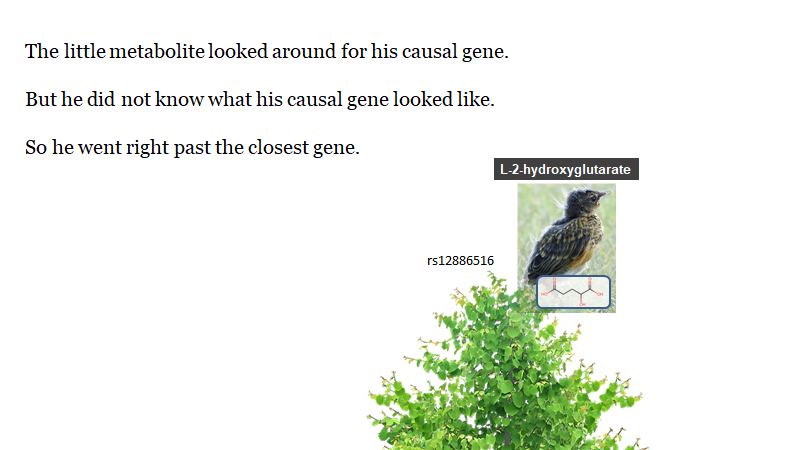
While it is true that the gene closest to a GWAS peak is not always the causal gene, it is also true that it usually is.
In fact, we can quantify how often we should expect the causal gene to be the closest gene, and that number is about 70%
3 papers from 2021 help pin this down:
In fact, we can quantify how often we should expect the causal gene to be the closest gene, and that number is about 70%
3 papers from 2021 help pin this down:
Activity-by-contact (ABC-Max) predicts a causal gene for a GWAS SNP using a combination of cell-type specific chromatin accessibility, epigenome marks and chromatin conformation, which can also be estimated by SNP-TSS distance: pubmed.ncbi.nlm.nih.gov/33828297/

https://twitter.com/jengreitz/status/1089552556852957184

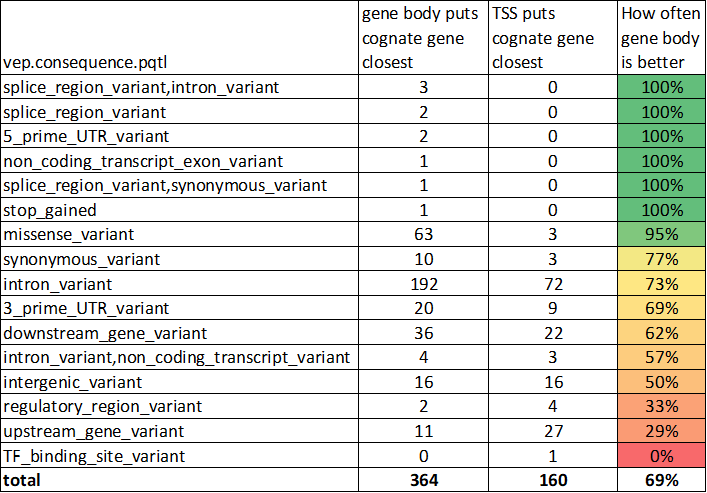
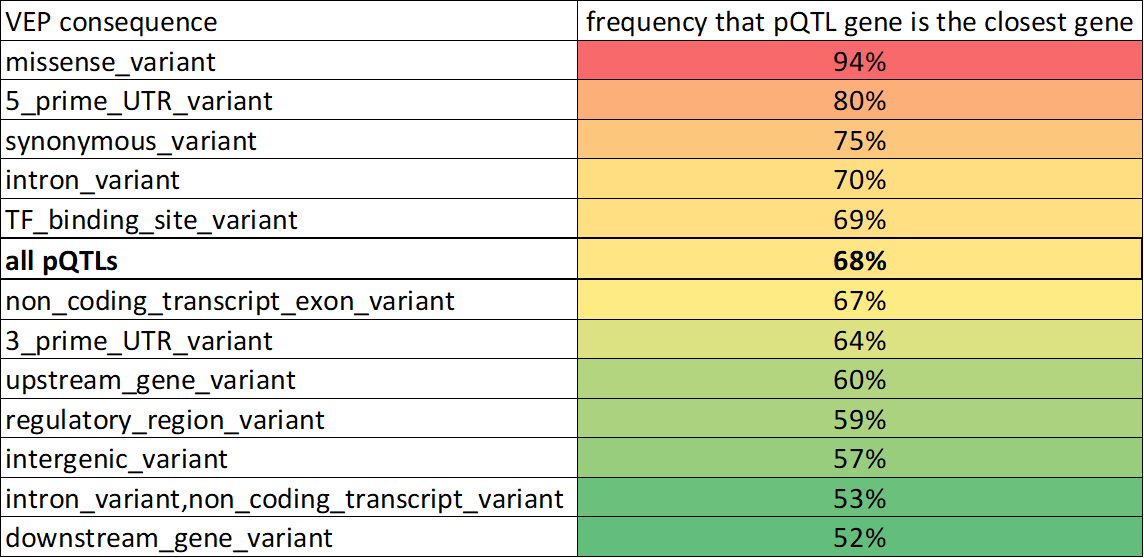
There were several large pQTL studies published in 2021. I've been referencing this one by @pietzner et al. When protein abundance is the trait, the hypothesis is the cognate gene (the one encoding the protein) is the causal gene:
pubmed.ncbi.nlm.nih.gov/34648354/
pubmed.ncbi.nlm.nih.gov/34648354/
https://twitter.com/Eric_Fauman/status/1448865165613621249
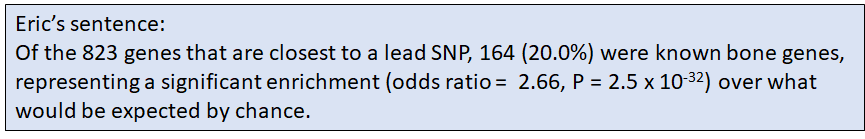
Regeneron's flagship paper on the exome sequencing effort in the UK Biobank included this now famous figure:
pubmed.ncbi.nlm.nih.gov/34662886/
pubmed.ncbi.nlm.nih.gov/34662886/
https://twitter.com/timfrayling/status/1453007643178676237
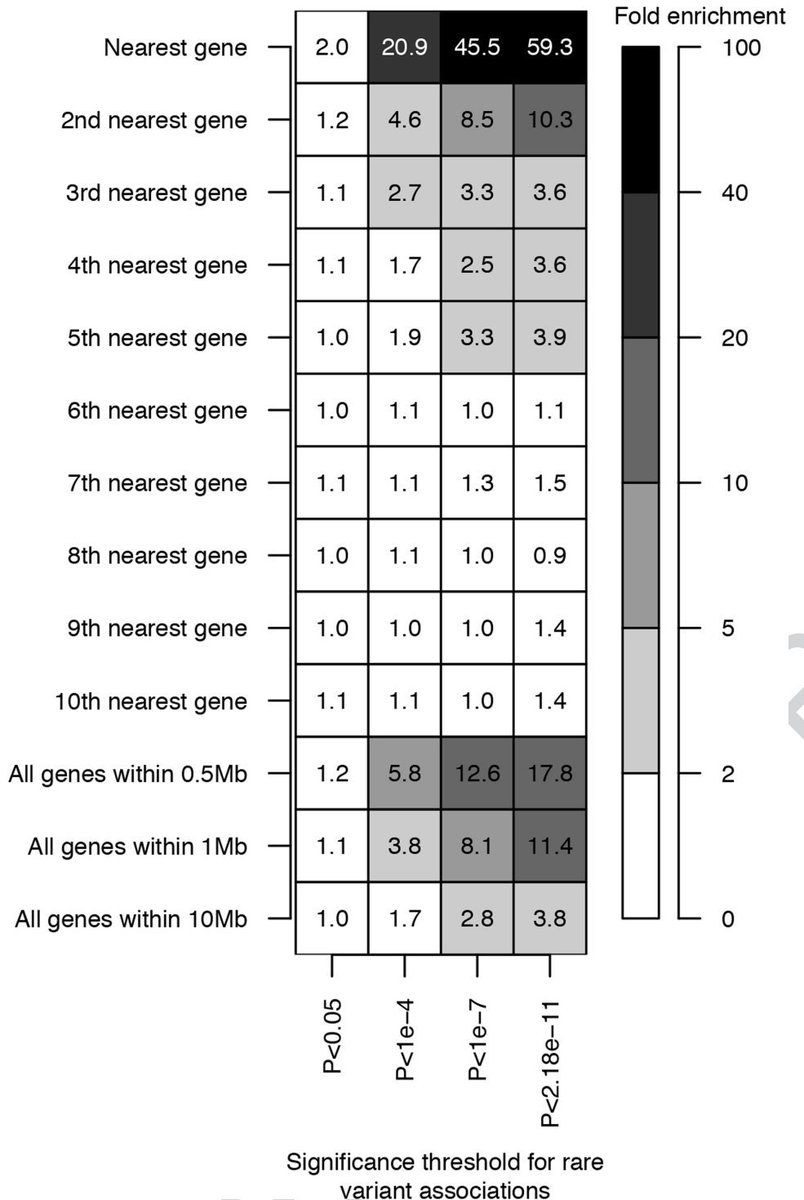
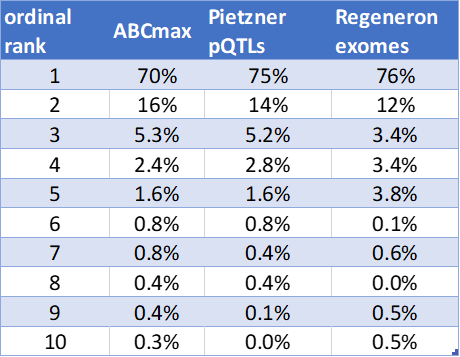
These papers provide 3 independent approaches to quantifying the distribution of ordinal rank for the causal gene from a lead GWAS SNP
Here I'm defining distance to the "gene body" (TSS-TES)
At least in ABCmax the lead variant has been fine-mapped.
closest gene: 70%-76%
Here I'm defining distance to the "gene body" (TSS-TES)
At least in ABCmax the lead variant has been fine-mapped.
closest gene: 70%-76%
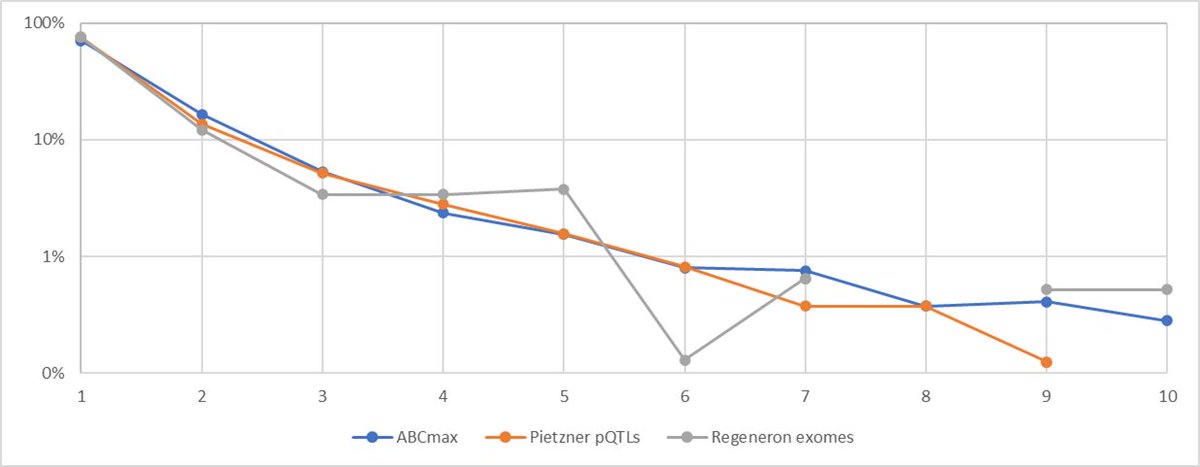
Here's another visualization of this amazing convergence, plotted on a log scale to capture some of the finer structure at higher ordinal rank.
And another link to the 3 papers:
pubmed.ncbi.nlm.nih.gov/33828297/
pubmed.ncbi.nlm.nih.gov/34648354/
pubmed.ncbi.nlm.nih.gov/34662886/
And another link to the 3 papers:
pubmed.ncbi.nlm.nih.gov/33828297/
pubmed.ncbi.nlm.nih.gov/34648354/
pubmed.ncbi.nlm.nih.gov/34662886/
• • •
Missing some Tweet in this thread? You can try to
force a refresh