Our latest Opinions and Lifestyle Survey covers the period 15 Dec-3rd Jan, during which new measures against the Omicron variant were introduced.

We asked adults about

▪️Behaviours and attitudes
▪️Boosters
▪️Lateral flows
▪️Travelling to work

➡️ow.ly/8JNG50Hpjoj Graphic text: Coronavirus and the social impacts on Great Br
Around one-third (35%) of adults reported they do not expect life to return to normal for more than one year (a rise from 20% in a similar period last year; 22 Dec 2020-3 Jan 2021).

66% of adults were very or somewhat worried about the impact of the pandemic on their lives. Graphic text:  35% Of adults do not expect life to return to
66% of adults reported having received two #COVID19 vaccines and a booster (46% in the previous period; 1-12 Dec 2021).

Most adults who had received two vaccine doses, but not yet a booster, said they would be very or fairly likely (89%) to have a booster vaccine if offered.
Almost 6 in 10 adults (57%) said they had taken a rapid lateral flow test in the past seven days (42% in the previous period), with higher proportions of younger people taking one compared with older people. Graphic showing hand holding a lateral flow swab and coronav
There were significant increases in those noticing most people wearing face masks in

🛒shops 66%)
🚌on public transport (65%)
🍽️and cafes, bars or restaurants (29%)

compared with 47%, 45% and 19% respectively in the previous period (1 to 12 Dec 2021).

➡️ow.ly/8JNG50Hpjoj

• • •

Missing some Tweet in this thread? You can try to force a refresh
 

Keep Current with Office for National Statistics (ONS)

Office for National Statistics (ONS) Profile picture

Stay in touch and get notified when new unrolls are available from this author!

Read all threads

This Thread may be Removed Anytime!

PDF

Twitter may remove this content at anytime! Save it as PDF for later use!

Try unrolling a thread yourself!

how to unroll video
  1. Follow @ThreadReaderApp to mention us!

  2. From a Twitter thread mention us with a keyword "unroll"
@threadreaderapp unroll

Practice here first or read more on our help page!

More from @ONS

7 Jan
Correction: due to an issue with our automated coding system, a number of deaths from week 51 were not cause coded until after the cut-off date for weekly deaths.

The numbers have now been updated in the corresponding publication: ow.ly/aWLT50HpsKB
13,013 deaths were registered in England and Wales in the week ending 24 December 2021 (Week 51).

This was

▪ 613 more than the previous week
▪ 1,465 (12.7%) more deaths than the five-year average

➡️ ow.ly/aWLT50HpsKB Total deaths from all causes were above the five-year averag
6.5% of all deaths registered in the week ending 24 December mentioned #COVID19 on the death certificate in England and Wales (852 deaths).

This was an increase in the number of deaths from the previous week (755 deaths, 6.1% of all deaths) ow.ly/aWLT50HpsKB
Read 5 tweets
6 Jan
The system average price (SAP) of gas decreased by 48% in the week to 2 Jan 2022, according to @NationalGridUK.

This large fall was in part driven by lower demand over the Christmas period because of reduced business activity and unseasonably mild weather ow.ly/SJKx50HoieZ
According to @Springboard_, overall retail footfall in the UK in the week to 2 Jan 2022 was 75% of the level seen in the equivalent week of 2019, lower than the previous week (86%) ow.ly/SJKx50HoieZ
81% of all UK businesses were fully trading in late Dec 2021, while 11% were partially trading. 

The transportation and storage industry continue to report the lowest percentage currently trading ow.ly/b00U50Hoil2
Read 5 tweets
6 Jan
The age of a property is the biggest single factor affecting how energy efficient homes are.

In England and Wales, homes built since 2012 are by far the most likely to have a high energy efficiency rating (C or higher) ow.ly/K2nn50HohP9 Graphic text:   The age of a property is biggest single fact
All homes need an energy efficiency rating when sold, let or constructed.

This indicates how much the home might cost to heat and power, and what its greenhouse gas emissions could be.

▪️A is the highest ⬆️
▪️and G is the lowest⬇️
98% of homes built since 2012 in both England and Wales are rated C or higher, compared with 12% of assessed homes built before 1900 in England, and 8% built before 1900 in Wales.

Homes built before 1900 make up one in six homes in England, and a fifth of homes in Wales. Graphic with bar chart text:  Homes built since 2012 rated C
Read 6 tweets
6 Jan
An estimated 1.3 million people living in private households in the UK (2.0% of the population) were experiencing self-reported long COVID as of 6 December 2021 ow.ly/5pxr50HohlR 1.3 million    people in the UK self-reported long COVID
Of people with self-reported long COVID in the 4 weeks to 6 December:

▪️ 21% first had/suspected #COVID19 less than 12 weeks ago
▪️ 70% first had/suspected COVID-19 at least 12 weeks ago
▪️ 40% first had/suspected COVID-19 at least one year ago.
Prevalence of self-reported long COVID remained greatest in those who were

▪️ aged 35 to 69 years
▪️ female
▪️ living in more deprived areas
▪️ working in health, social care or teaching and education
▪️ with another activity-limiting health condition or disability.
Read 4 tweets
5 Jan
Latest #COVID19 estimates show, in the week ending 31 Dec 2021 infection rates continued to increase across all four countries of the UK ow.ly/SFMy50HnBcE Graphic text : Estimated nu...
Infections continued to increase across all English regions in the week up to 31 Dec 2021, with the lowest rates seen in the South West.

There were early indications of a slowing of infections in London, however it is too early to suggest a change in the overall trend. Graphic text: 1 in 10 Estim...
#COVID19 infection rates continued to increase across all age groups in England in the week ending 31 Dec 2021, with the highest rates still seen in school age children and young adults.
Read 5 tweets
22 Dec 21
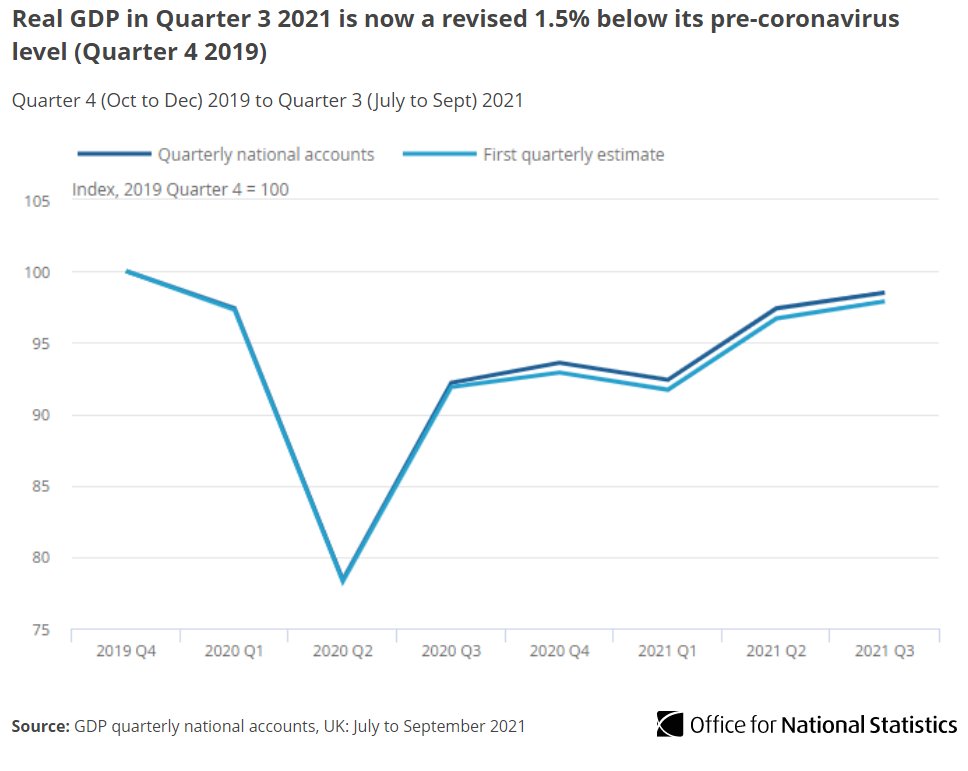
GDP growth has been revised from 1.3% to 1.1% in Q3 2021.

However, upward revisions to 2020 means GDP in Q3 is 1.5% below its pre pandemic level ow.ly/7tzw50Hh5Ui Line chart title: Real GDP in Quarter 3 2021 is now a revise
Commenting on today’s revised GSP figures, ONS Director of Economic Statistics, Darren Morgan said:⬇️

(1/4) Quote graphic text: “Our revised figures show UK GDP recov
Darren continued:⬇️

(2/4) Quote graphic text:   “However, stronger data for 2020 mea
Read 7 tweets

Did Thread Reader help you today?

Support us! We are indie developers!


This site is made by just two indie developers on a laptop doing marketing, support and development! Read more about the story.

Become a Premium Member ($3/month or $30/year) and get exclusive features!

Become Premium

Too expensive? Make a small donation by buying us coffee ($5) or help with server cost ($10)

Donate via Paypal

Or Donate anonymously using crypto!

Ethereum

0xfe58350B80634f60Fa6Dc149a72b4DFbc17D341E copy

Bitcoin

3ATGMxNzCUFzxpMCHL5sWSt4DVtS8UqXpi copy

Thank you for your support!

Follow Us on Twitter!

:(