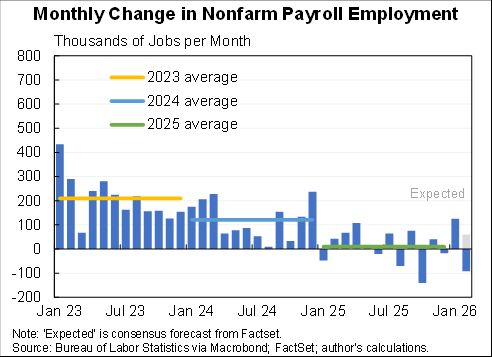
The economy added 6.4 million jobs in 2021, a 4.5 percent increase in jobs. that makes 2021 the seventh fastest year for job creation since the aftermath of World War II.
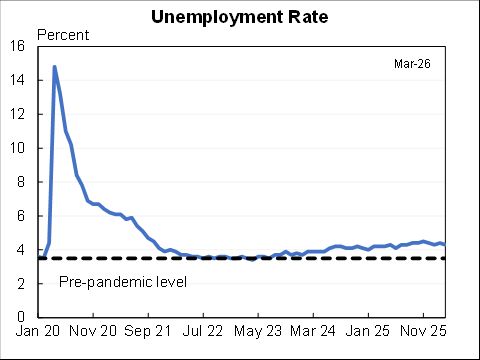
The unemployment rose very rapidly in March & April 2020 but then it has fallen rapidly ever since. Cumulatively the unemployment rate was 6.5 point-years above it's pre-recession value. That is about typical for postwar recessions and much better than the financial crisis.
The unemployment rate is falling much faster than forecast. Now is well below what the Survey of Professional Forecasters expected in every forecast they have made since the pandemic hit. BUT, labor force participation would likely be worse than what they would have forecasted.
Employment rates are still down relative to pre-pandemic for most age-sex groups. A larger fraction of men than women have stopped working with larger employment declines for the prime-age population than for younger people (whose employment has gone up) or retirement age.
Overall employment is 2.7 million workers short of what CBO forecast prior to the pandemic while jobs (based on surveying employers) are 4.4 million short. This indicates that there is still work to do. FIN.
• • •
Missing some Tweet in this thread? You can try to
force a refresh
Average hourly earnings growth has been drifting down recently. Was strong for much of 2023 but negative three months in a row--zero for the last 6 months (I use a 6 month line instead of my usual 3 due to high volatility).
Overall +0.7% since pre-COVID.
Same story if you exclude generally higher-paid managers and focus on production and non-supervisory workers--also zero over the last six months but in this case is much stronger over the full period, up 2.8% since pre-COVID.
No matter how you look at it average hourly workers for all private sector workers are below trend. They're up at a 0.2% annual rate since pre-COVID, were growing much faster before then.
A lot of that is higher-paid workers not doing as well...
The CPI-based Ecumenical Underlying Inflation measure was 3.5% in April, up from 3.3% in February and 3.4% in March. Although it is normalized to be equivalent to the PCE has been running (unusually) ~50bp higher than PCE.
Is the median of 7 measures over 3, 6 and 12 months.
It includes the official BLS measures plus median and trimmed mean.
Note, core, median and trimmed mean have been running about the same, suggesting it is not special factors elevating inflation--except leaving over the possibility of one giant special factor in all three, shelter, which has lags.
I won't make you wait for the full set of numbers. All of them slowed a bit from previous months.
A certain amount has been made about how it's *all* shelter. That is true over 12 months, core CPI ex shelter up 2.1%. But over the last six months is a 2.9% annual rate so that more reassuring number has a lot of lagged data in it.
Pretty much a goldilocks job report. 175K jobs is respectable at any time and in the context of strong prior months so a ~250K monthly average even more so.
Unemployment ticked up to 3.9%.
Earnings growth slowed.
Most reassuring data for the Fed in the last 2+ weeks.
The unemployment rate has been below 4.0% for more than two years now. A very slight upward drift.
At the same time the prime age employment rate is rising again and remains above pre-COVID. This had not been the pattern for the last few recessions.
Productivity growth came in at a 0.3% annual rate in Q1. It is very volatile so here are annualized growth rates in rough order of meaningfullness:
Since 2019-Q4: 1.5%
Last two years: 1.2%
Last year: 2.9%
Last quarter: 0.3%
Overall productivity is about 1% below CBO's pre-pandemic forecast.
(The fact that output is a little above CBO's pre-pandemic forecast is because labor, particularly through immigration, has come in higher than expected.)
Europe is way below trend and falling. Very different from the picture above.
Job openings and quits both fell in March as a wide range of labor market indicators are consistent with a cooling economy--and a labor market that, broadly, is like where it was in 2019--with lower quits but higher openings (with a question of whether openings were trending up).
The number of job openings per unemployed worker fell from 1.4 last month to 1.3 this month--both well below its peak of 2.0 in March 2022. This is still above pre-COVID but, again, it might have been on an upward trend.
These are a variety of indicators of labor market tightness, all normalized to the same standard deviation and a mean of zero pre-COVID. They're all roughly around pre-COVID.