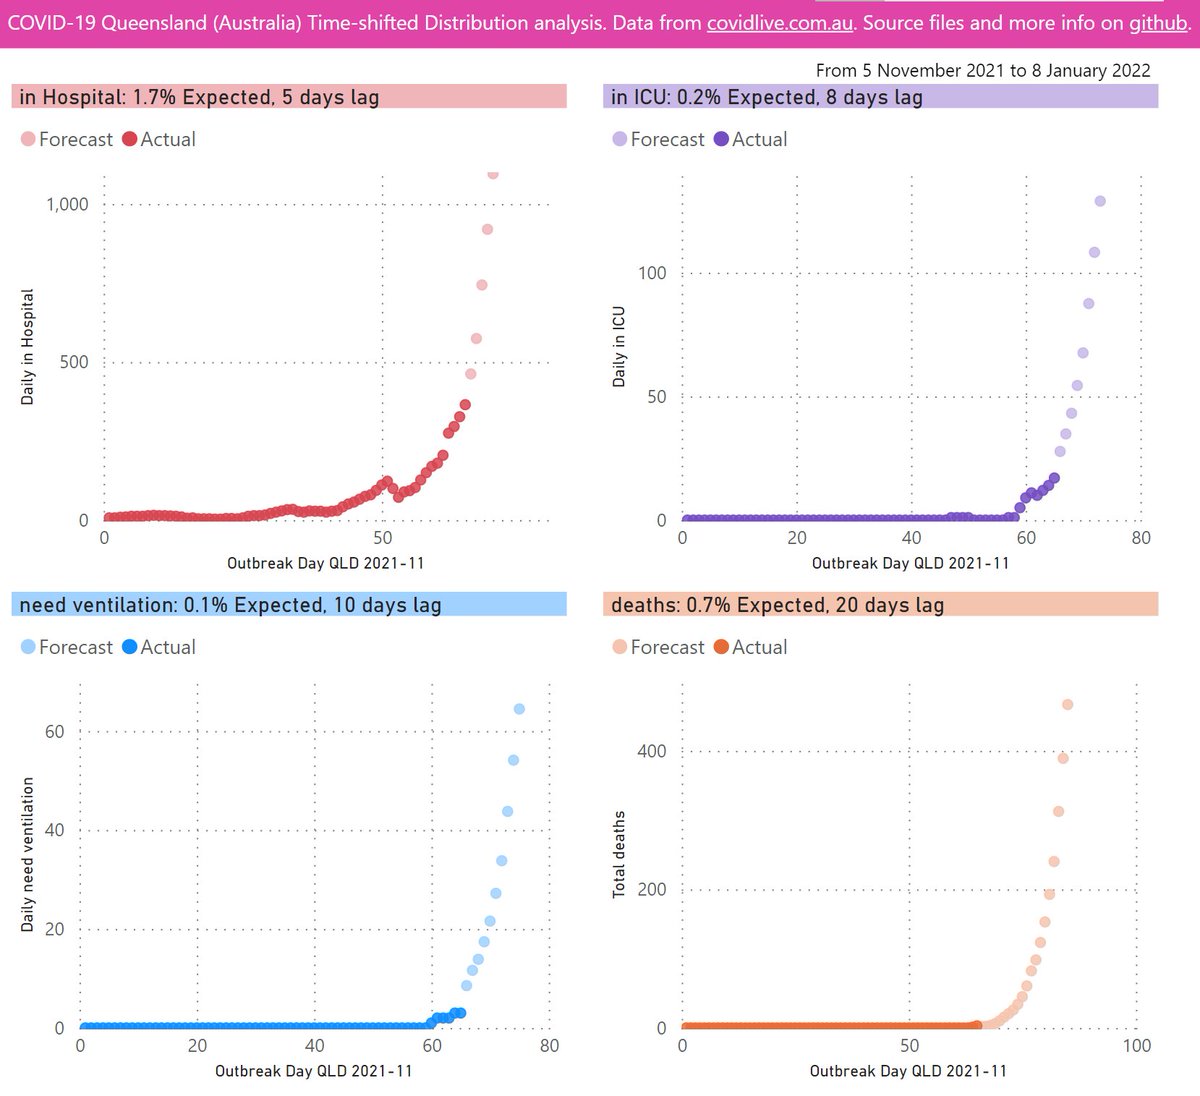
South Australia time-shifted distribution update for 8 Jan 22:
A forecast of outcomes from severe COVID-19, based on active cases:
- hospitalisations (322* by 13 Jan)
- ICU (69* by 16 Jan)
- cases needing ventilation (23 by 18 Jan)
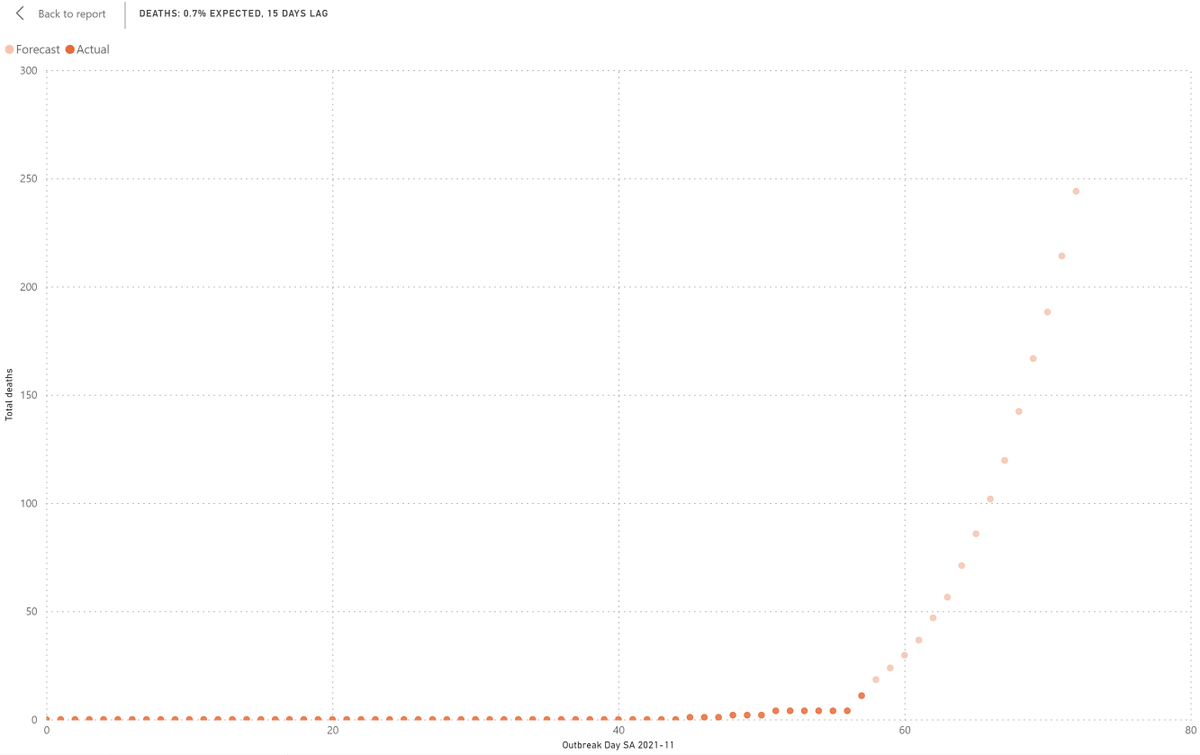
- deaths (167 by 23 Jan)
🧵
* As actual numbers had drifted from the forecasts for several series, I've adjusted the % Expected:
- hospitalisations now 1.0% (was 1.3%)
- ICU now 0.2% (was 0.3%)
** actual cases currently needing ventilation are so low they are below the bounds of this forecasting tool.
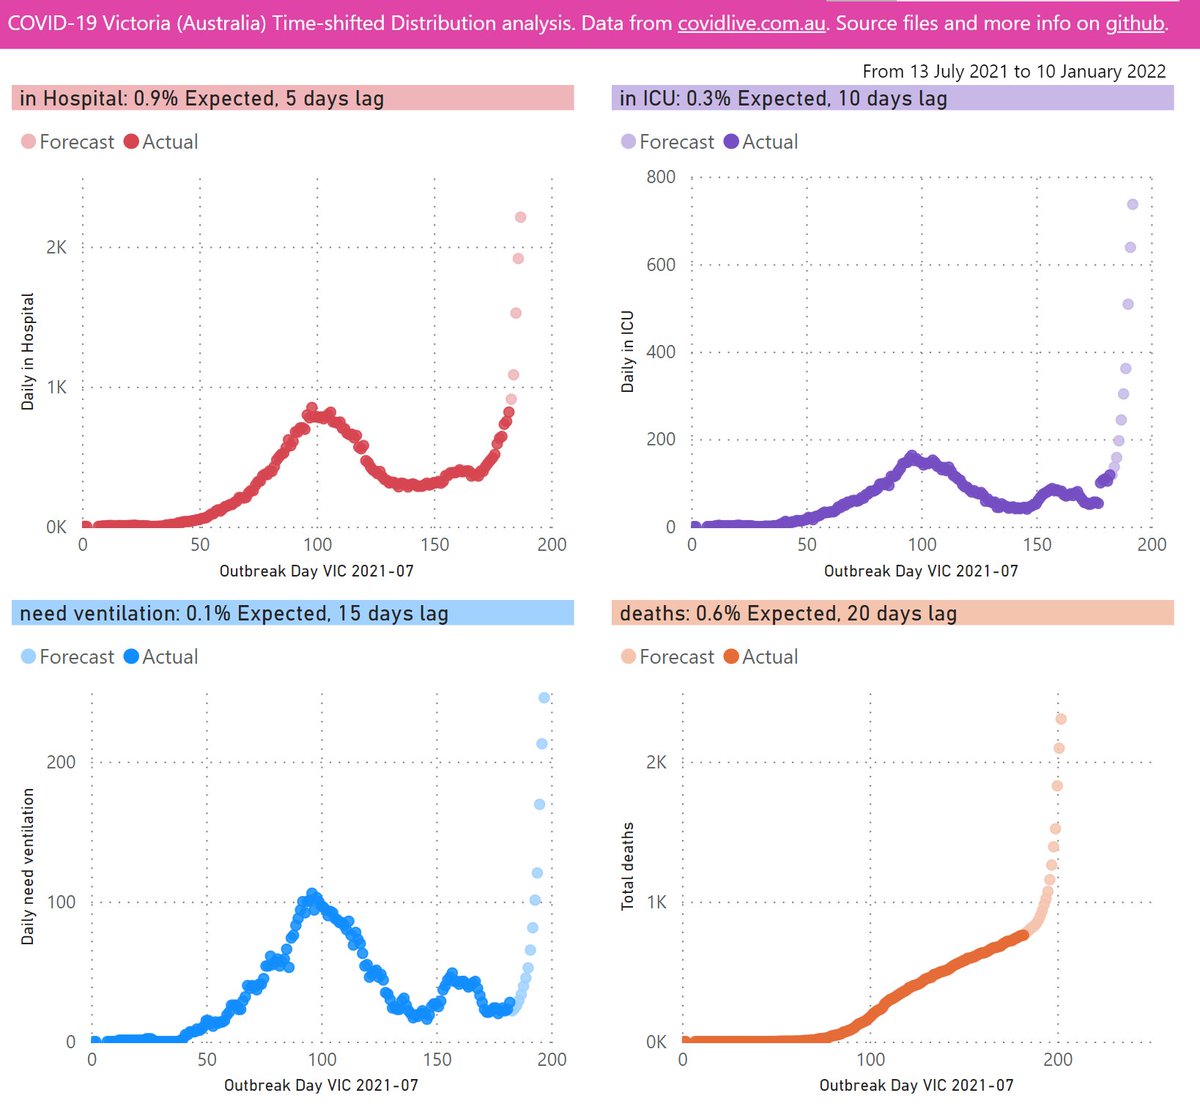
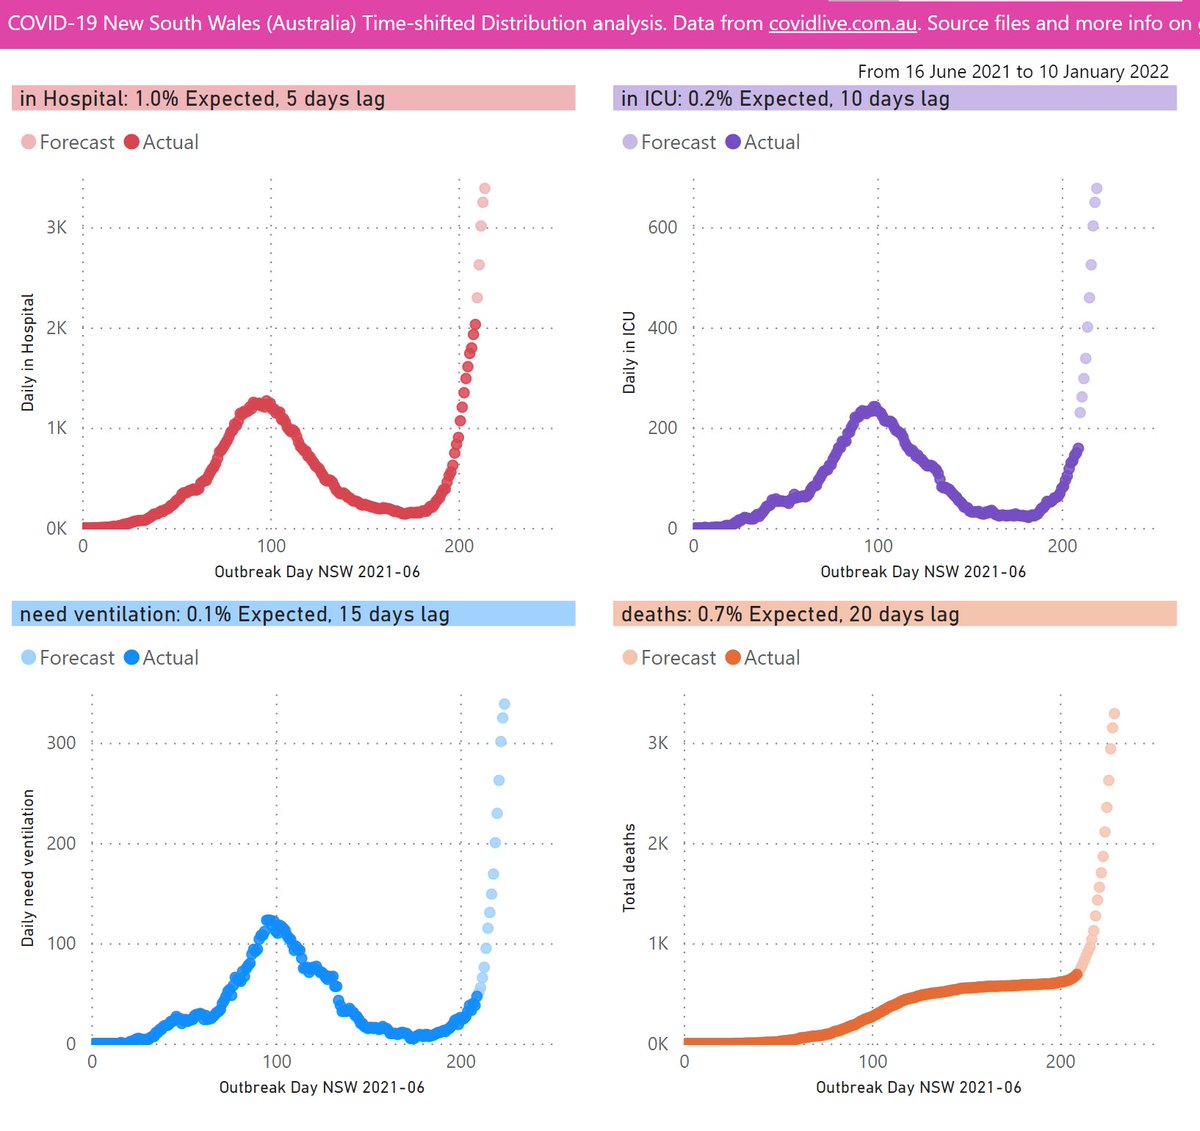
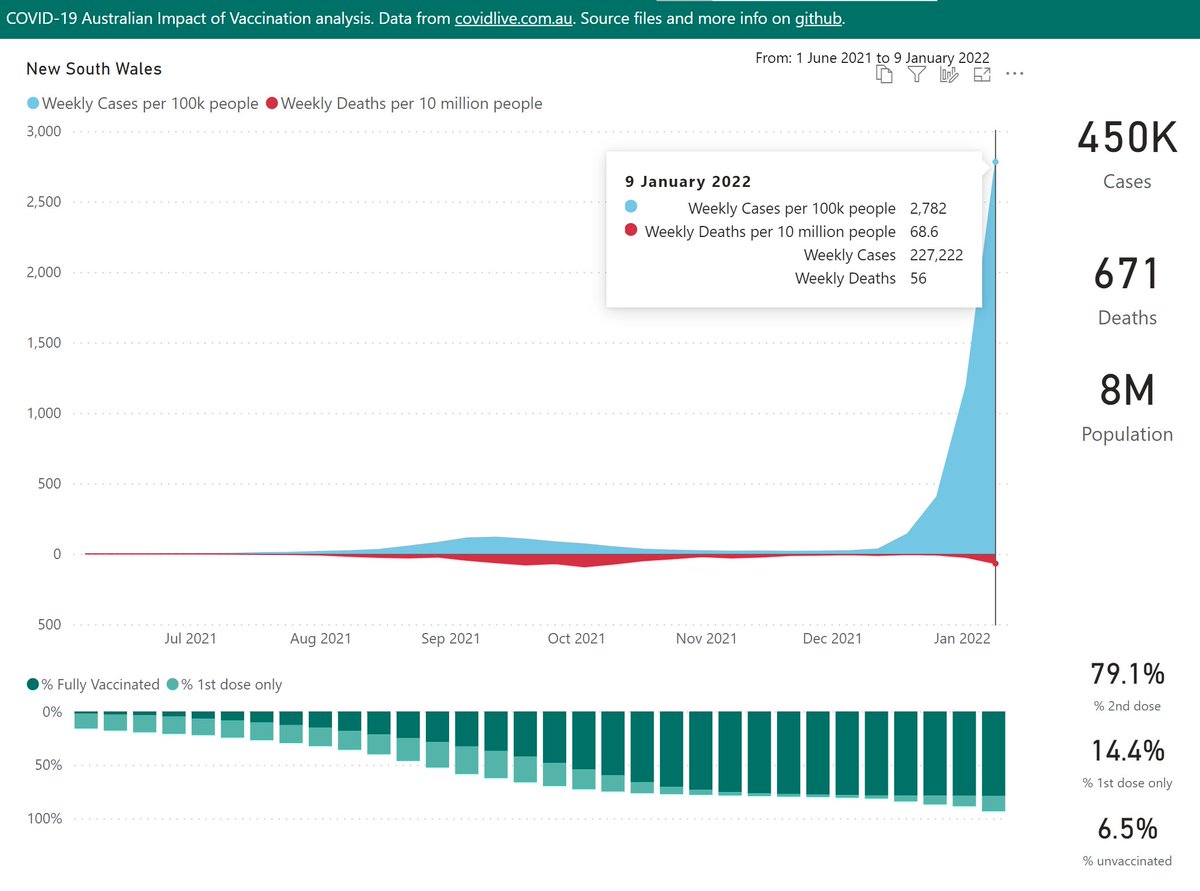
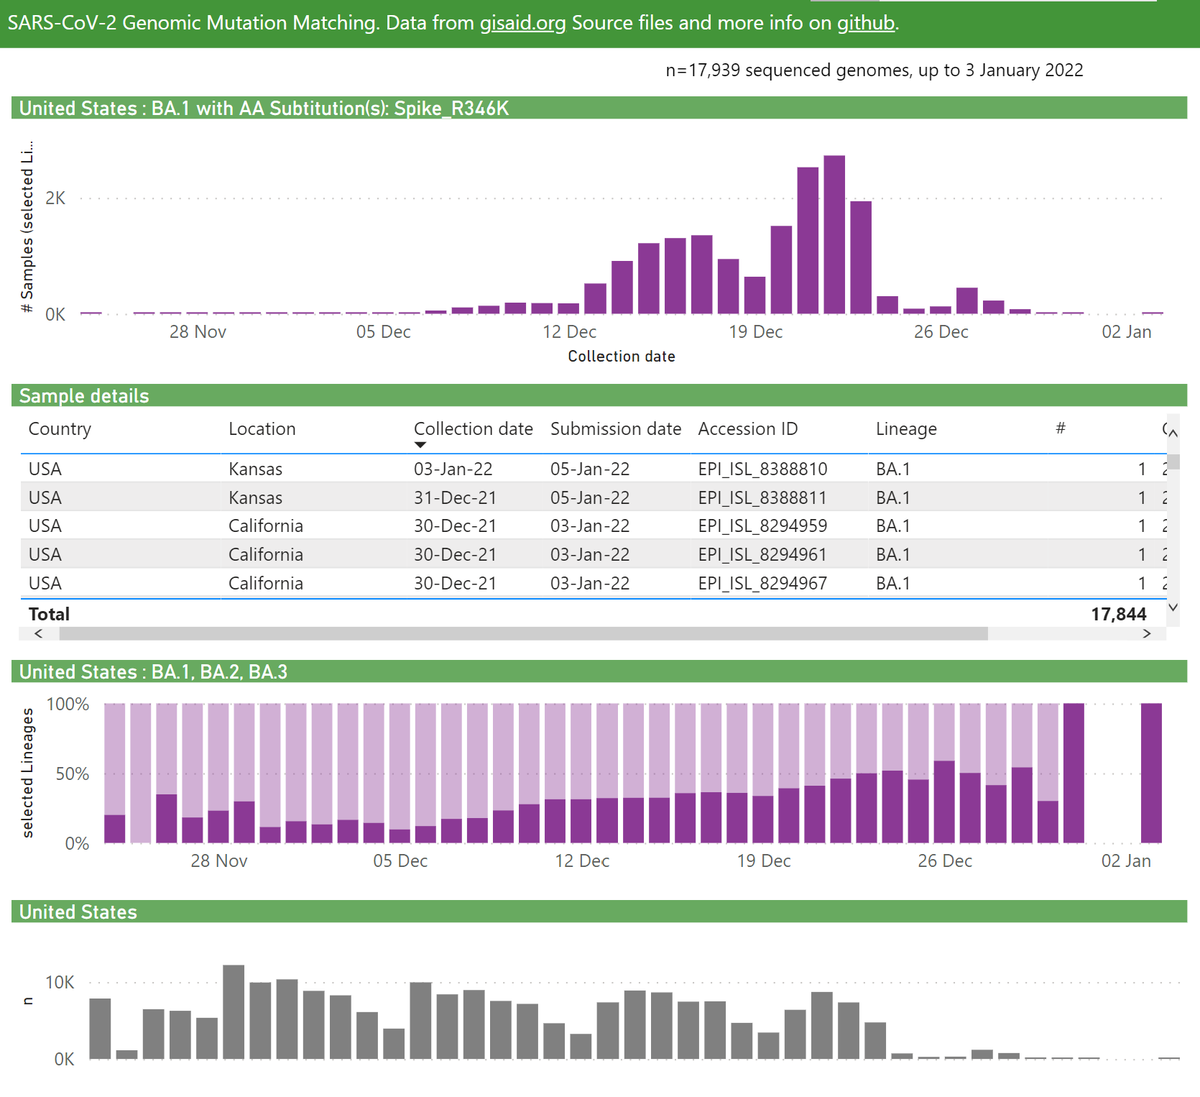
South Australia is the purest Omicron outbreak worldwide, based on genomic sequencing data.
Comparing to other Australian states (where Delta is more prevalent), the differences are:
- hospitalisation & vent % are lower
- death lag is shorter (note: small sample size)
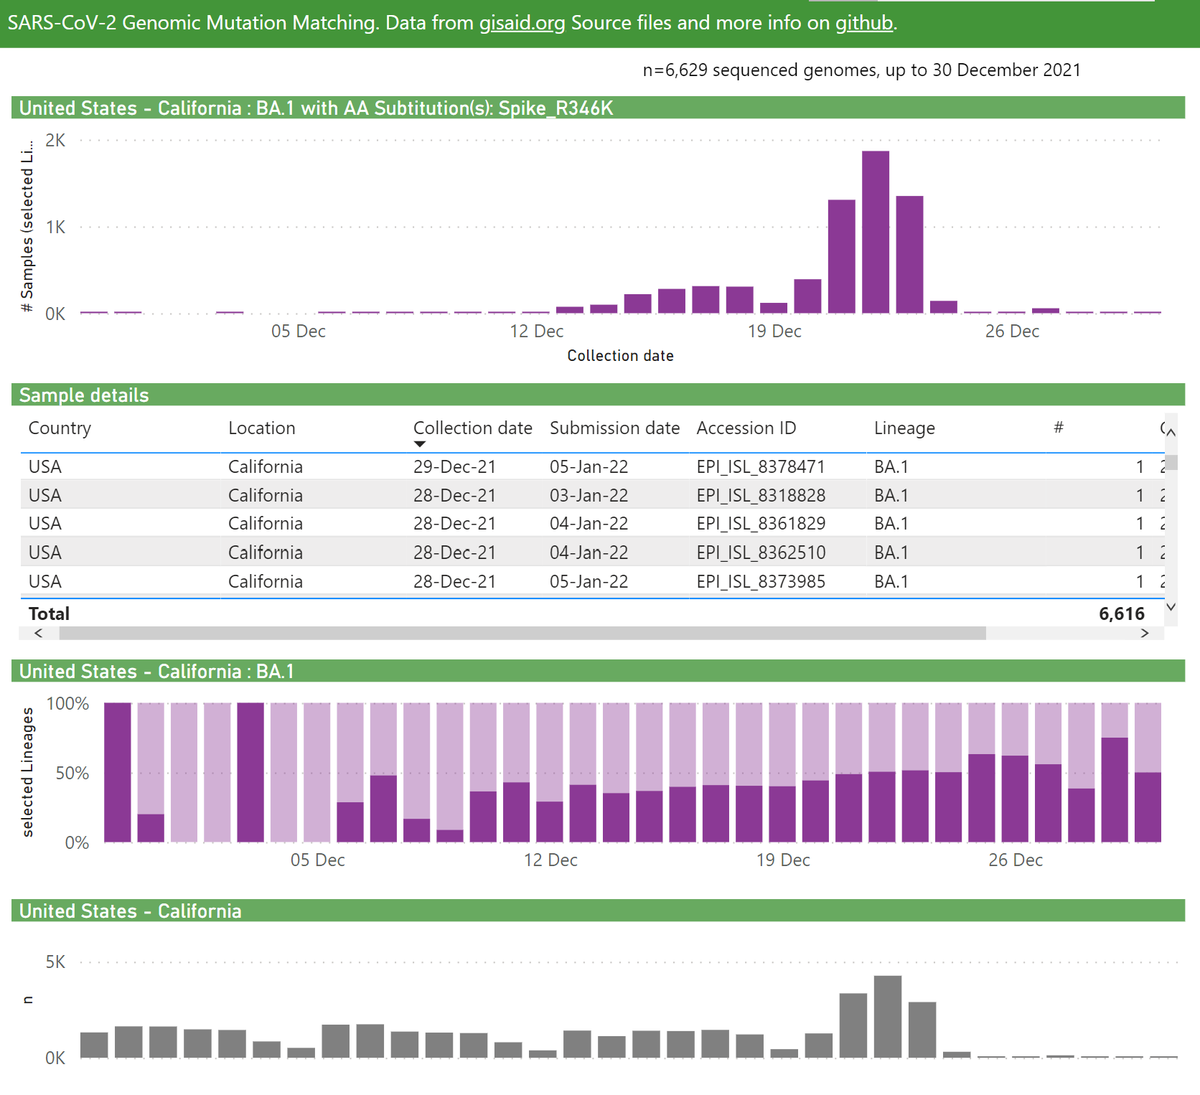
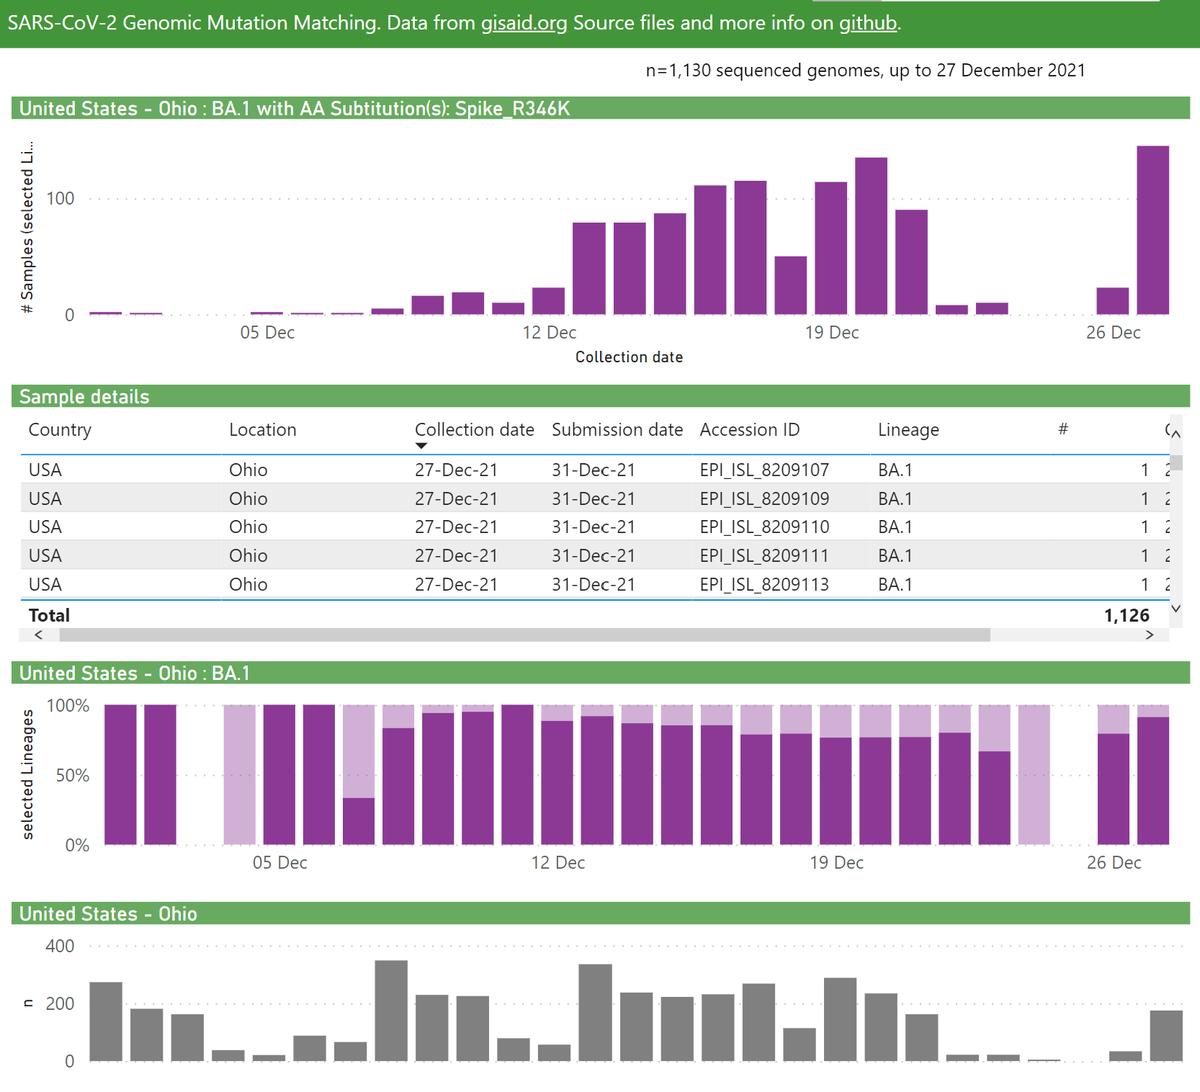
Latest genomic sequencing analysis for South Australia.
Victoria time-shifted distribution update for 10 Jan 22:
A forecast of outcomes from severe COVID-19, based on active cases:
- hospitalisations (2,210* by 15 Jan)
- ICU (737 by 20 Jan*)
- cases needing ventilation (246 by 25 Jan*)
- deaths (2,304 by 30 Jan)
🧵
* As actual numbers had drifted from the forecasts for some series, I've adjusted the settings:
- hospitalisations now 0.9% (was 1.4%)
- ICU now 0.3% with 10-day lag (was 8-day)
- ventilation now 0.1% with 15-day lag (was 10-day)
A big drop in the hospitalisation % - good news!
The lags for ICU and ventilation have now returned to their pre-Delta settings, which appear to give a closer fit.
New South Wales time-shifted distribution update for 10 Jan 22:
A forecast of outcomes from severe COVID-19, based on active cases:
- hospitalisations (3,387* by 15 Jan)
- ICU (677 by 20 Jan*)
- cases needing ventilation (339 by 25* Jan)
- deaths (3,291 by 30 Jan)
🧵
* As gaps were opening up between the actual and forecast for some series, I've adjusted the % Expected:
- hospitalisations now 1.0% (was 1.4%)
- ICU now 0.2% with 10-day lag (was 8-day)
- ventilation now 0.1% with 15-day lag (was 10-day)
The lags for ICU and ventilation have now returned to their pre-Delta settings, which appears to give a closer fit.
Here's an analysis of cases, deaths and vaccinations, for Australia, broken down by state/territory.
First at the national level. Cases have more than tripled in the latest week, as "let it rip" policies have allowed rampant Omicron spread in most regions.
Denmark was the only comparable country with a higher case rate in the prior week.
Their Omicron outbreak built on many weeks of Delta spread, which was not the case in much of Australia.
New South Wales has led the "let it rip" / "live with the virus" charge. They have not yet started including RAT counts, so the cases are only what could be processed by their overwhelmed PCR testing capacity.
Deaths typically lag cases by 3 weeks, so are starting to increase.
Queensland time-shifted distribution update for 8 Jan 22:
A forecast of outcomes from severe COVID-19, based on active cases:
- hospitalisations (1,096* by 13 Jan)
- ICU (129* by 16 Jan)
- cases needing ventilation (64 by 18 Jan)**
- deaths (467 by 28 Jan)
🧵
As actual numbers had drifted from the forecasts for several series, I've adjusted the % Expected:
- hospitalisations now 1.7% (was 2.4%)
- ICU now 0.2% (was 0.3%)
** actual cases currently needing ventilation are so low they are below the bounds of this forecasting tool.
Sadly, deaths are slightly ahead of the forecast, noting the sample size is very small.
With very high levels of Omicron, QLD might be experiencing the same affect as SA - deaths occurring sooner than for Delta outbreaks.
Here's the current snapshot of Active Clusters by category, highlighting today's new clusters.
The Aged Care category returned today, with 2 new large clusters.
🧵
It's hard to follow what the thinking is with Aged Care clusters. Since 2 Jan they've disappeared, then re-appeared, then repeated that again.
For months this dataset has proven over and over to be the shoddiest I've ever encountered, in my career of 30+ years.
Clusters with added cases today:
+41 3642 Fronditha Care Aged Care Clayton South*
+14 Novotel ibis Melbourne Central Melbourne*
+11 4314 Estia Health Altona Meadows*
+4 Beyond the City New Years Festival 30 to 31 Jan Melbourne
+3 Confirmed Omicron Sircuit Bar Fitzroy
Here's an analysis of the frequency of the Spike R346K mutation in BA.1 (Omicron) samples from the USA and Mexico. This mutation is understood to help evade immunity.
Firstly for the USA at the country level, they recently represent 40-60%, roughly double the global rate.
🧵
Samples from California are driving that trend, with 40-60% including the Spike R346K mutation.
Ohio samples show an even higher frequency: 80-90% include the Spike R346K mutation.