Data Visualisation and Data Integration specialist - Melbourne, Australia
https://t.co/U523OiUH7T
Support my projects by sponsoring me on Github
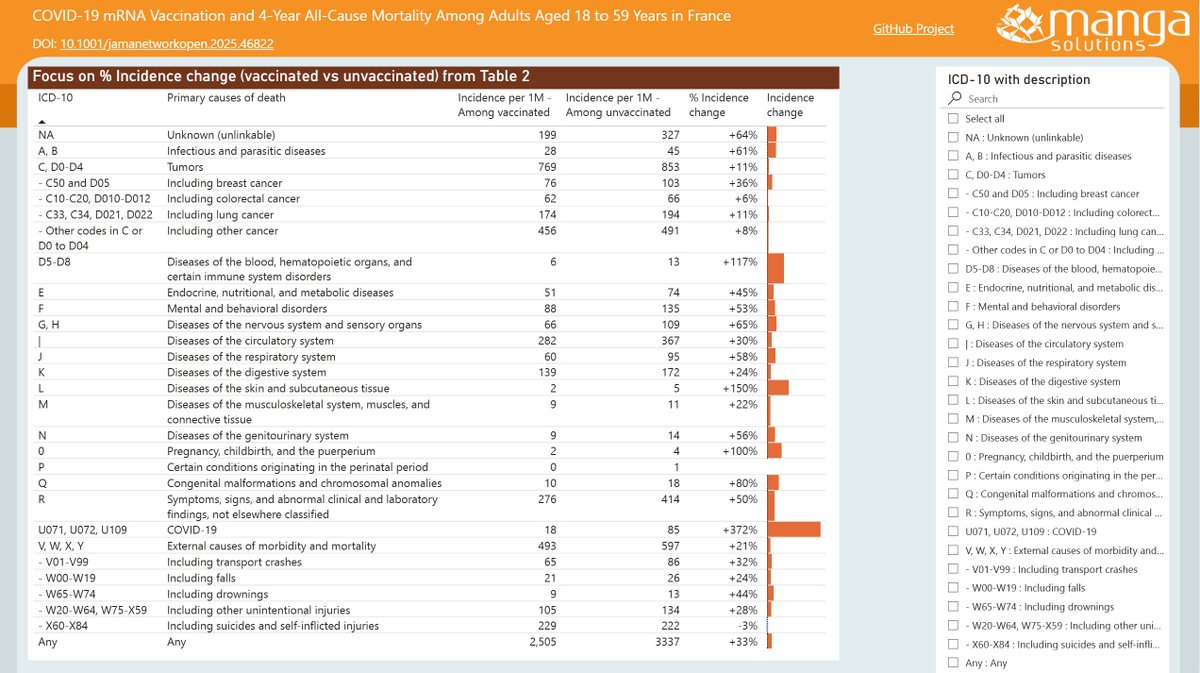 On the first page, I've added a % Incidence change (vaccinated vs unvaccinated) and emphasised that with data bars. This is quicker for general readers to grasp than hazard ratios.
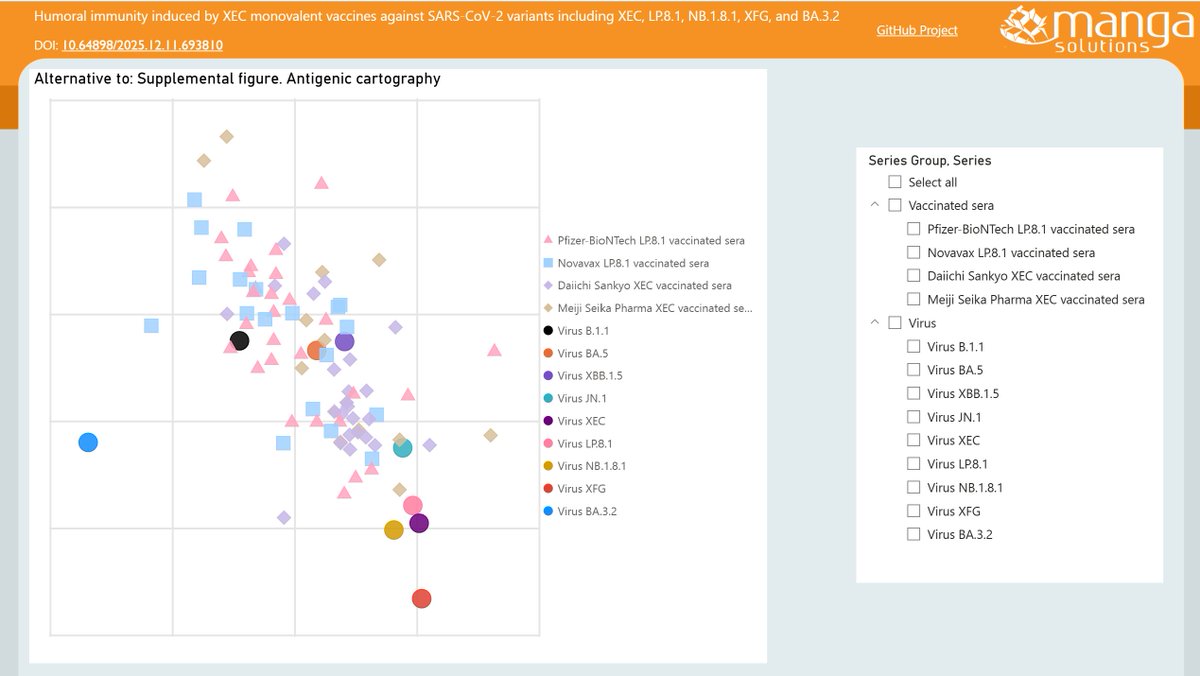 The map shows starkly that BA.3.2 "Cicada" is a wild outlier, way out on its own in the south-west corner. This suggests the current vaccines and/or disease-acquired immunity will not offer strong protection against infection.
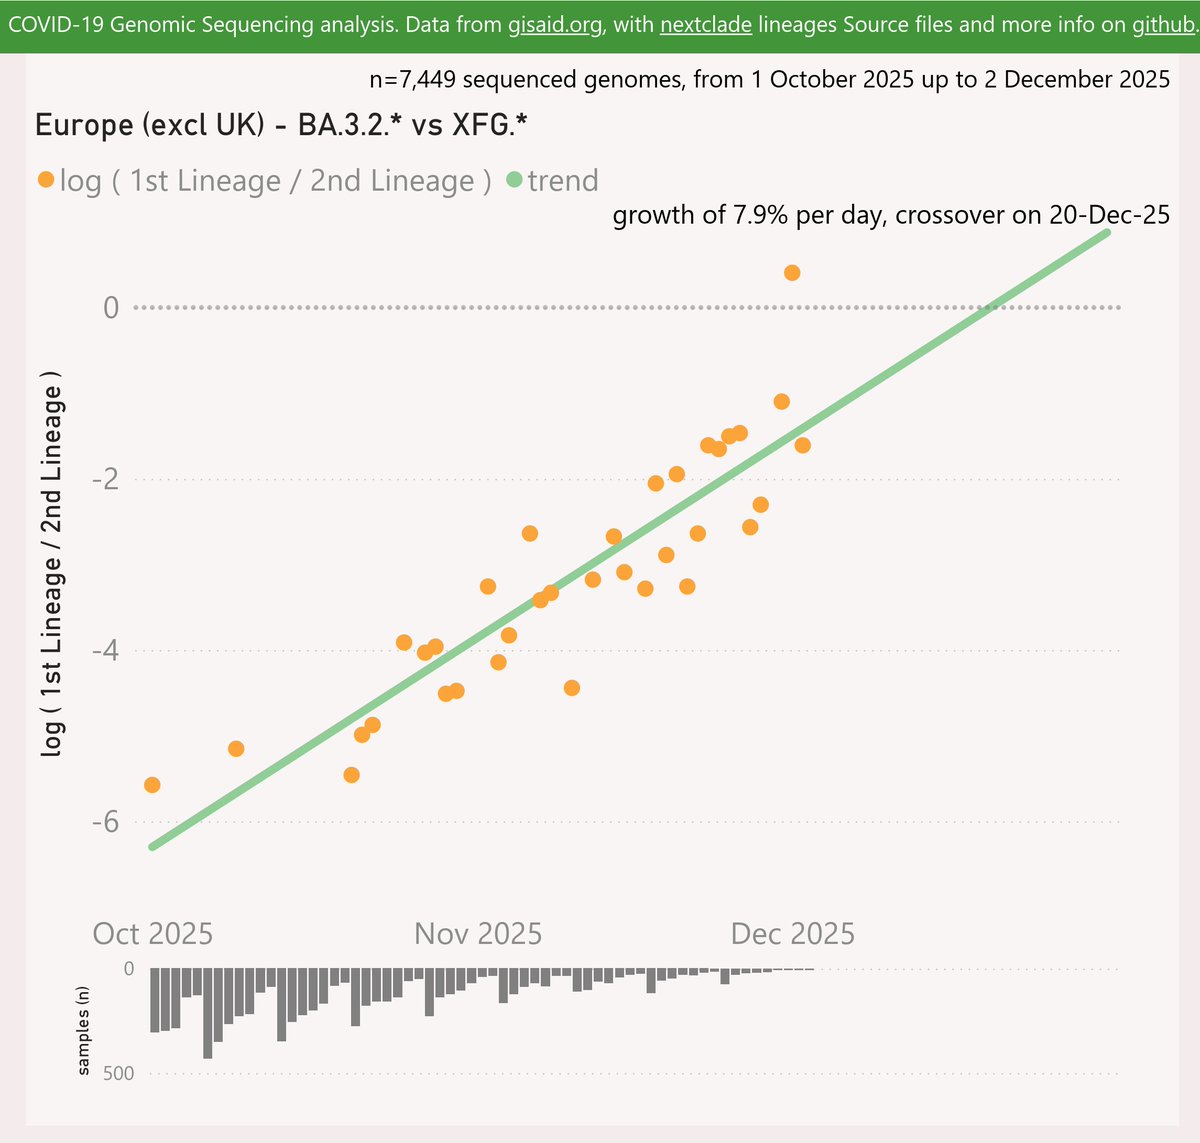 To include the latest BA.3.2.* samples, I have rolled my reporting window forward an extra week or so. So the most recent data is even less representative than usual. The picture for those dates might change as more data is shared.
 To include the latest BA.3.2.* samples, I have rolled my reporting window forward an extra week. So the most recent data is even less representative than usual. The picture for those dates might change as more data is shared.
 Above, I’ve re-cast the data behind their Figures 3 and 5 in terms of % change from the baseline. Hopefully this is useful to help compare the subsets, whose results vary in scale.
 XFG.1.1 is emerging as a new contender. It is characterised by a reversion to Spike W452R, which captured the attention of the Variant Hunters.

 Note I have rolled my reporting window forward an extra week, to capture this development. So recent samples are even thinner than usual.
 WA Health revamped their dashboard using Power BI, so it is more interactive now and a bit easier to get precise values. However they paused the wastewater variant analysis for 3 weeks, so I’ve estimated the values in that gap.
 Both are at low frequencies globally, but are already remarkably widespread geographically. New entrant XGA might be flattered by the low recent sample volumes.
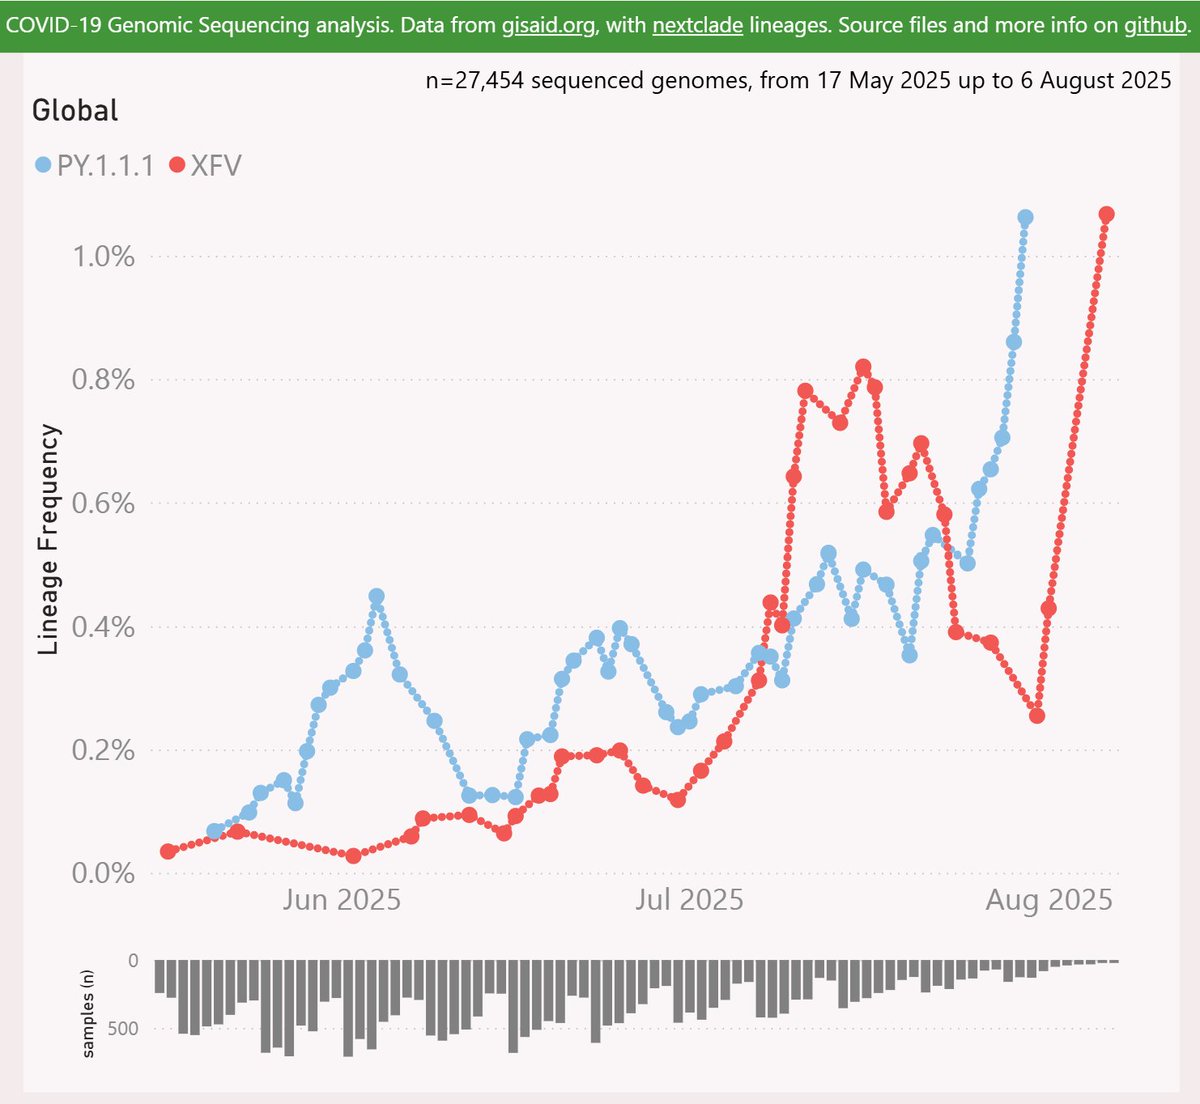 PY.1.1.1 is descended from "FLiRT" variant LF.7.9.1. PY.1.1 added the K679R mutation, then PY.1.1.1 added A435S (same mutation that characterised NB.1.8.1).
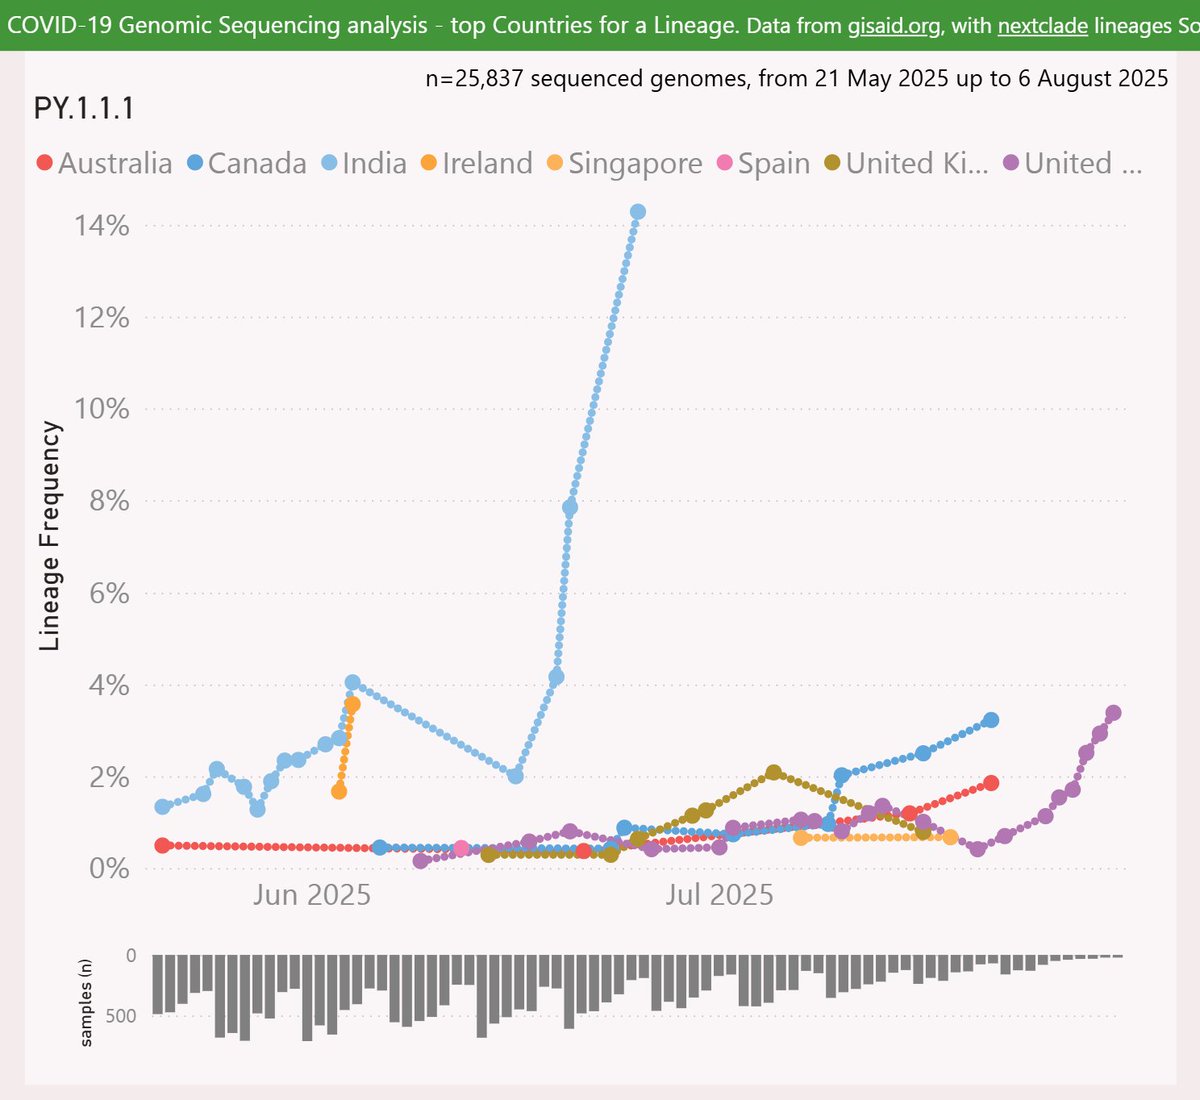
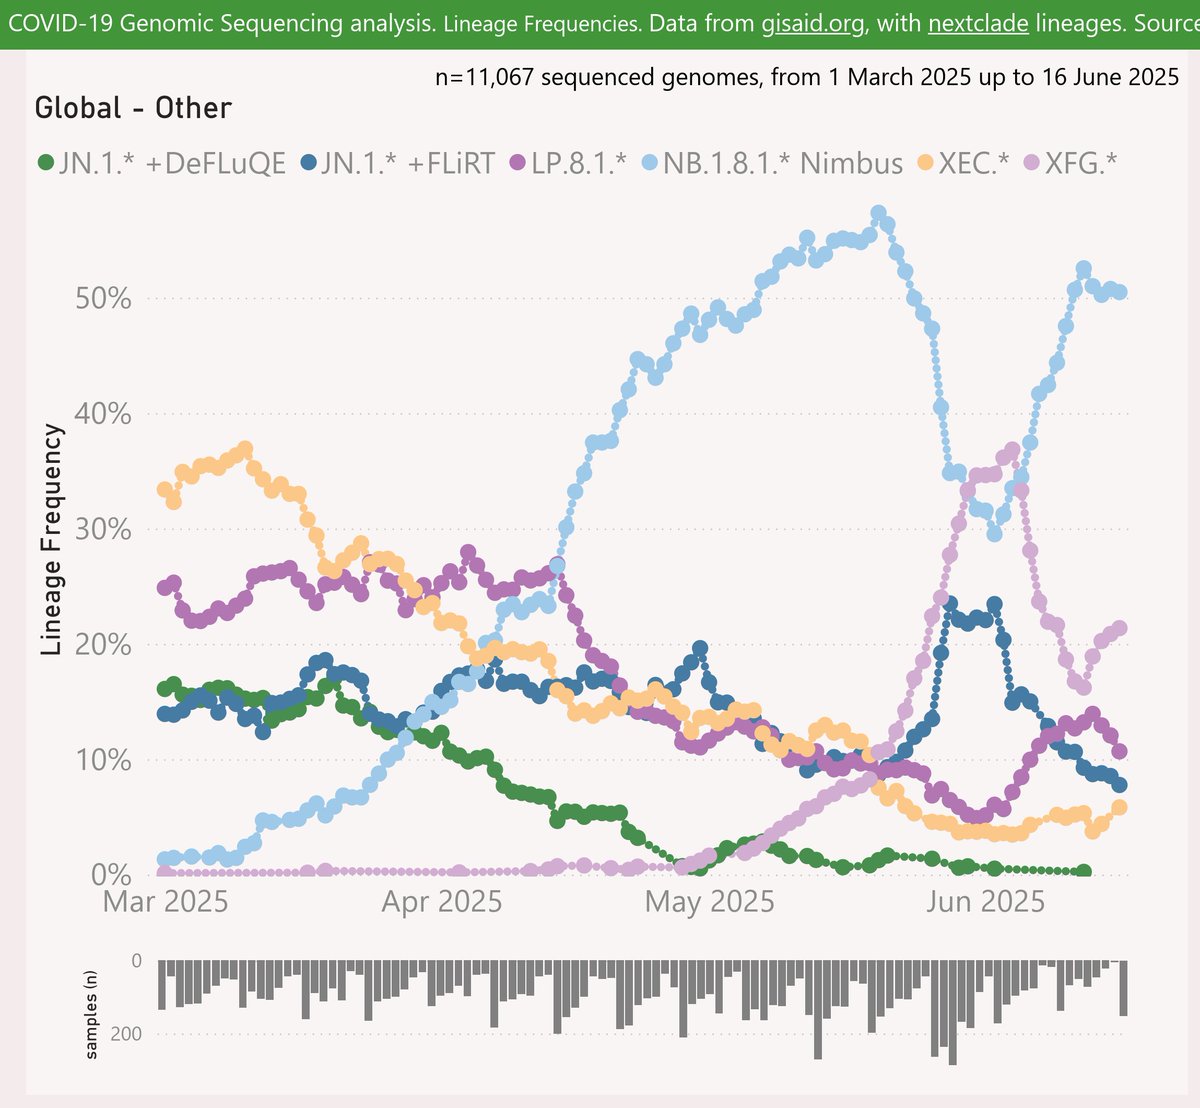
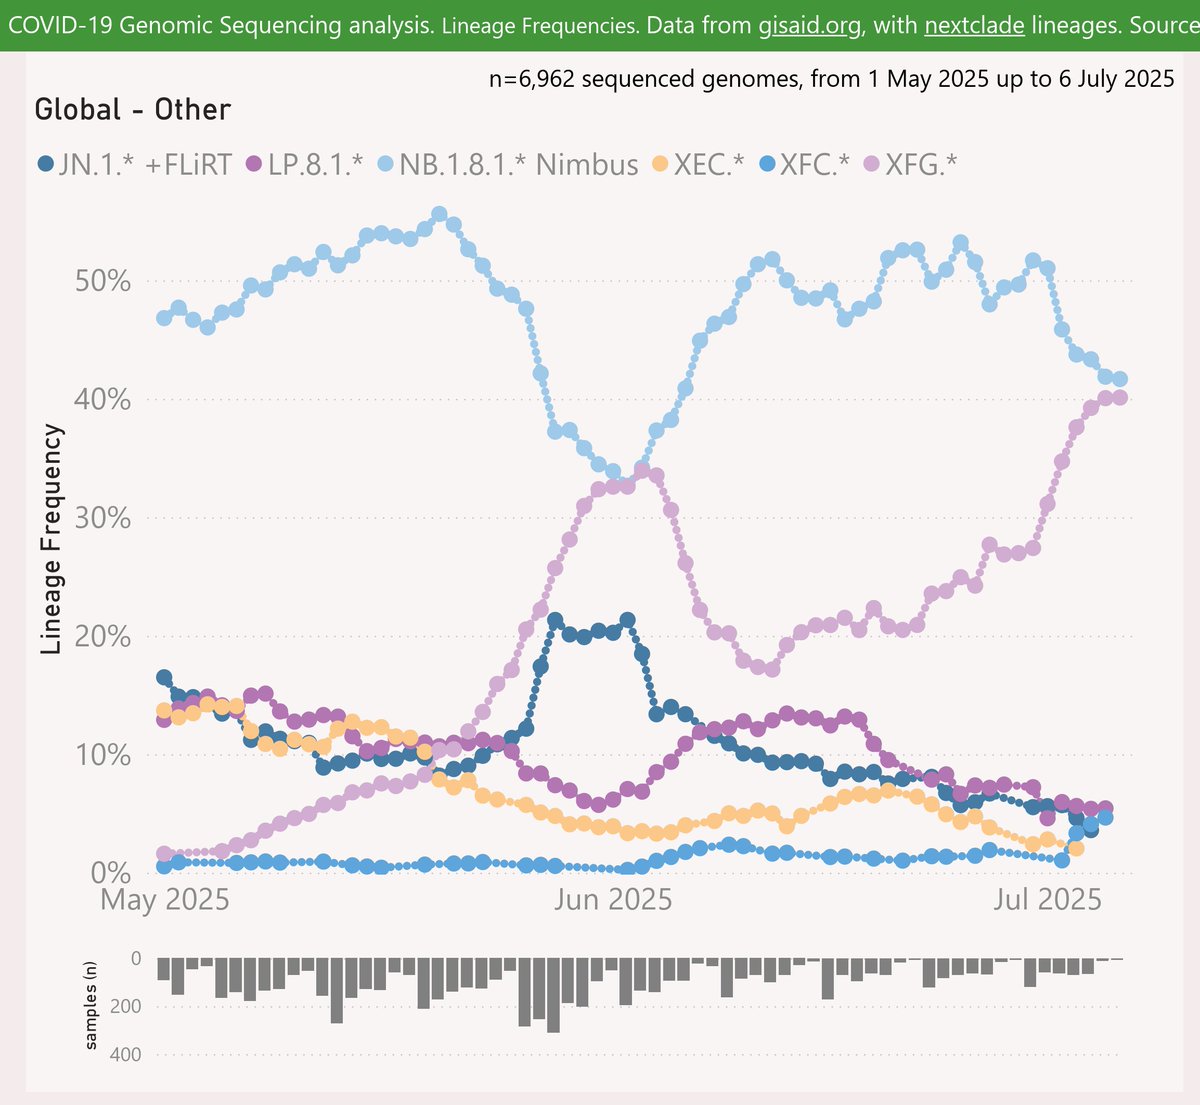 This perspective excludes all the high-volume countries and regions that I routinely report on: Australia, NZ, Europe, Canada and the US. The remaining countries are aggregated into this report.
 Here are the leading US states reporting XFG.* "Stratus". New York state reported strong growth to 78%.
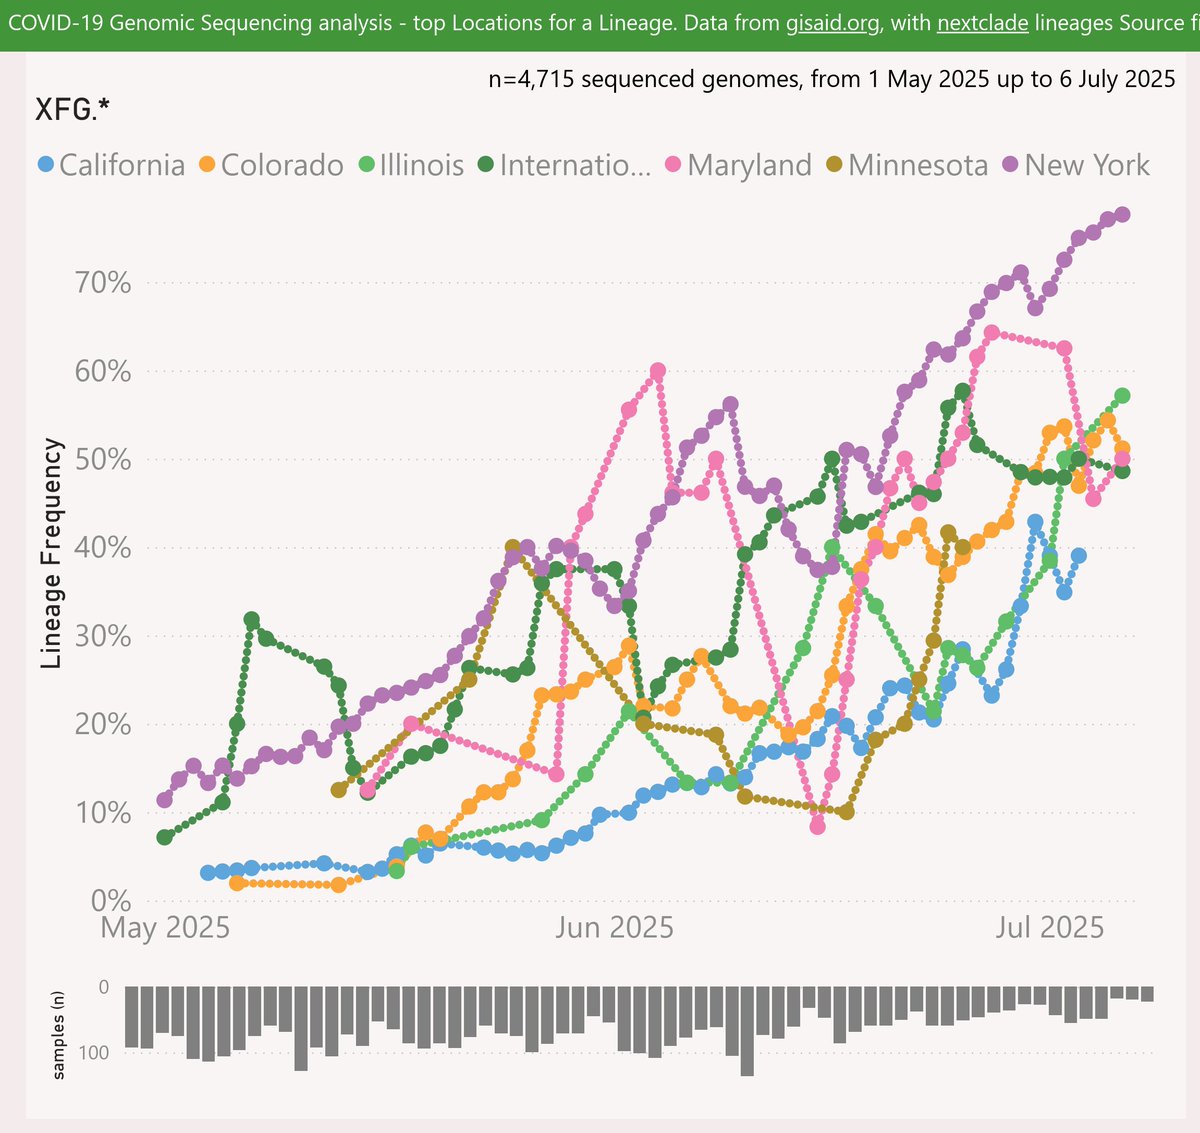
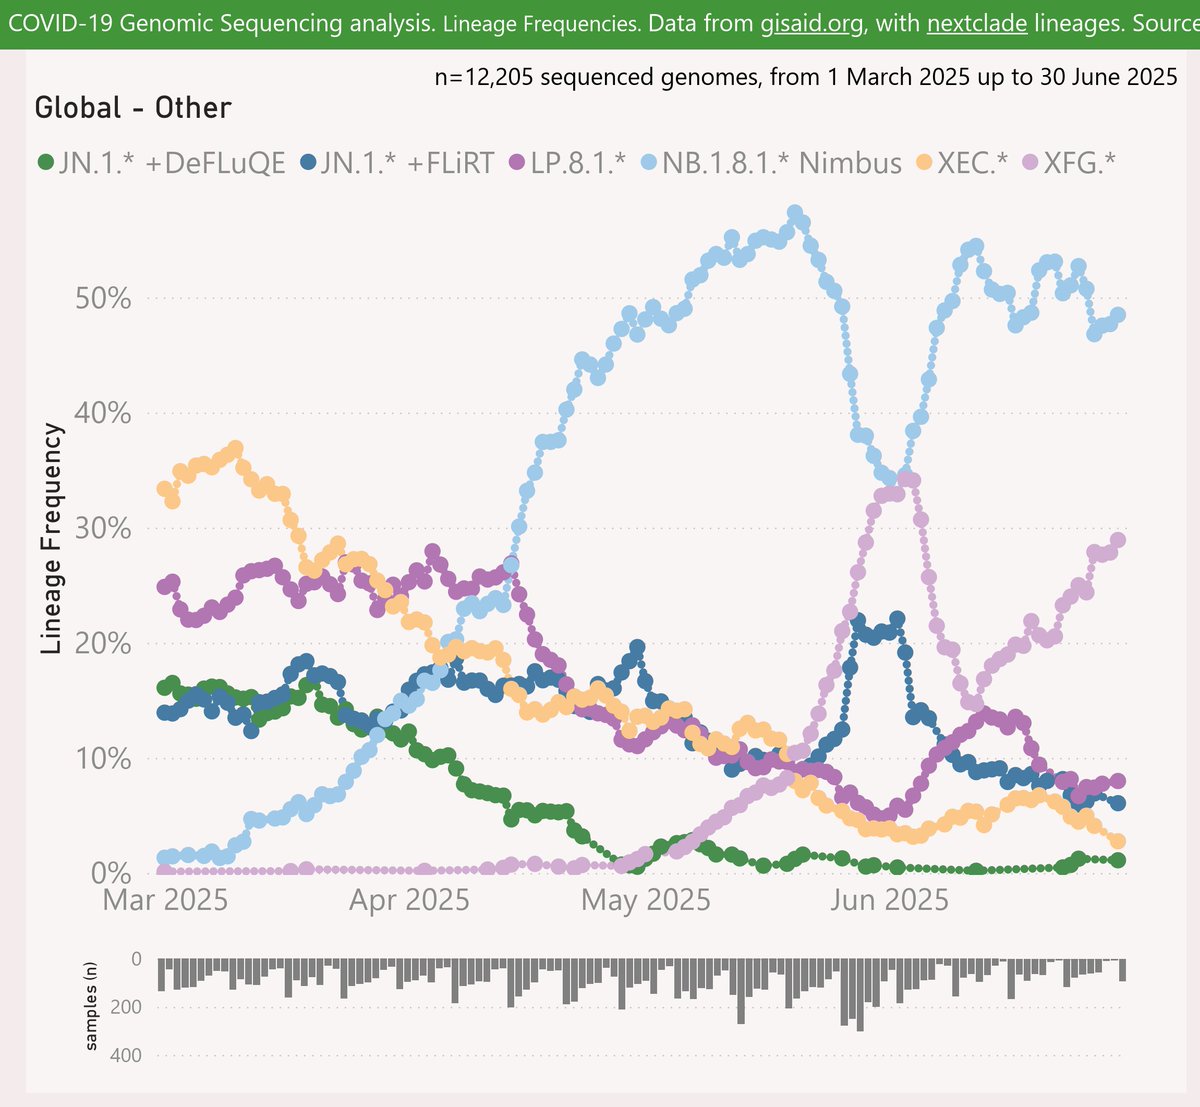 The volatility is due to the ragged timing of submissions from various countries.
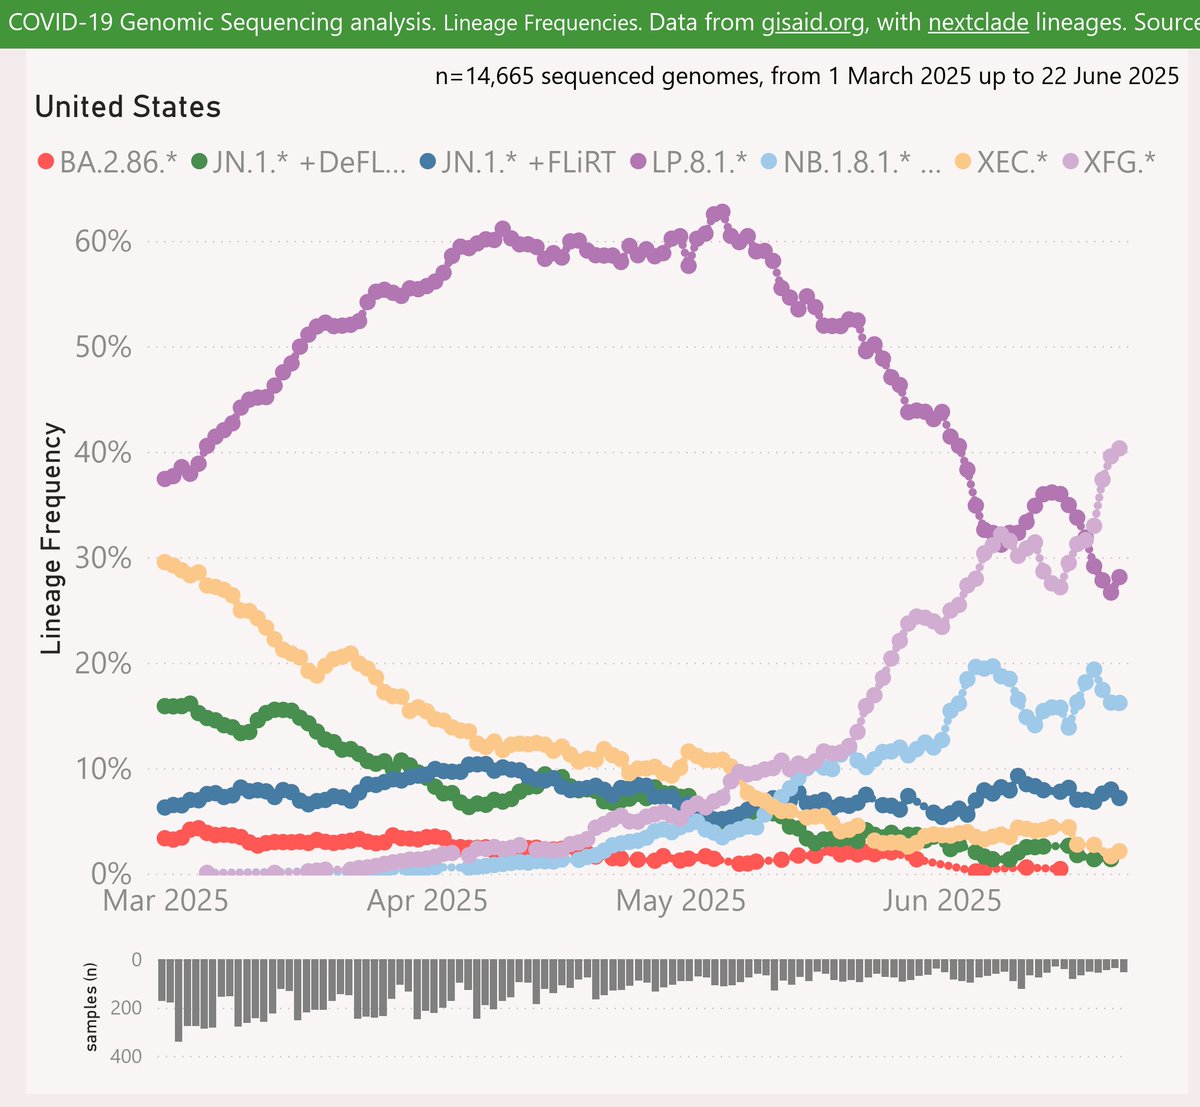 For the US, the XFG.* "Stratus" variant shows a strong growth advantage of 5% per day (35% per week) over LP.8.1.*, with a crossover in mid-June.
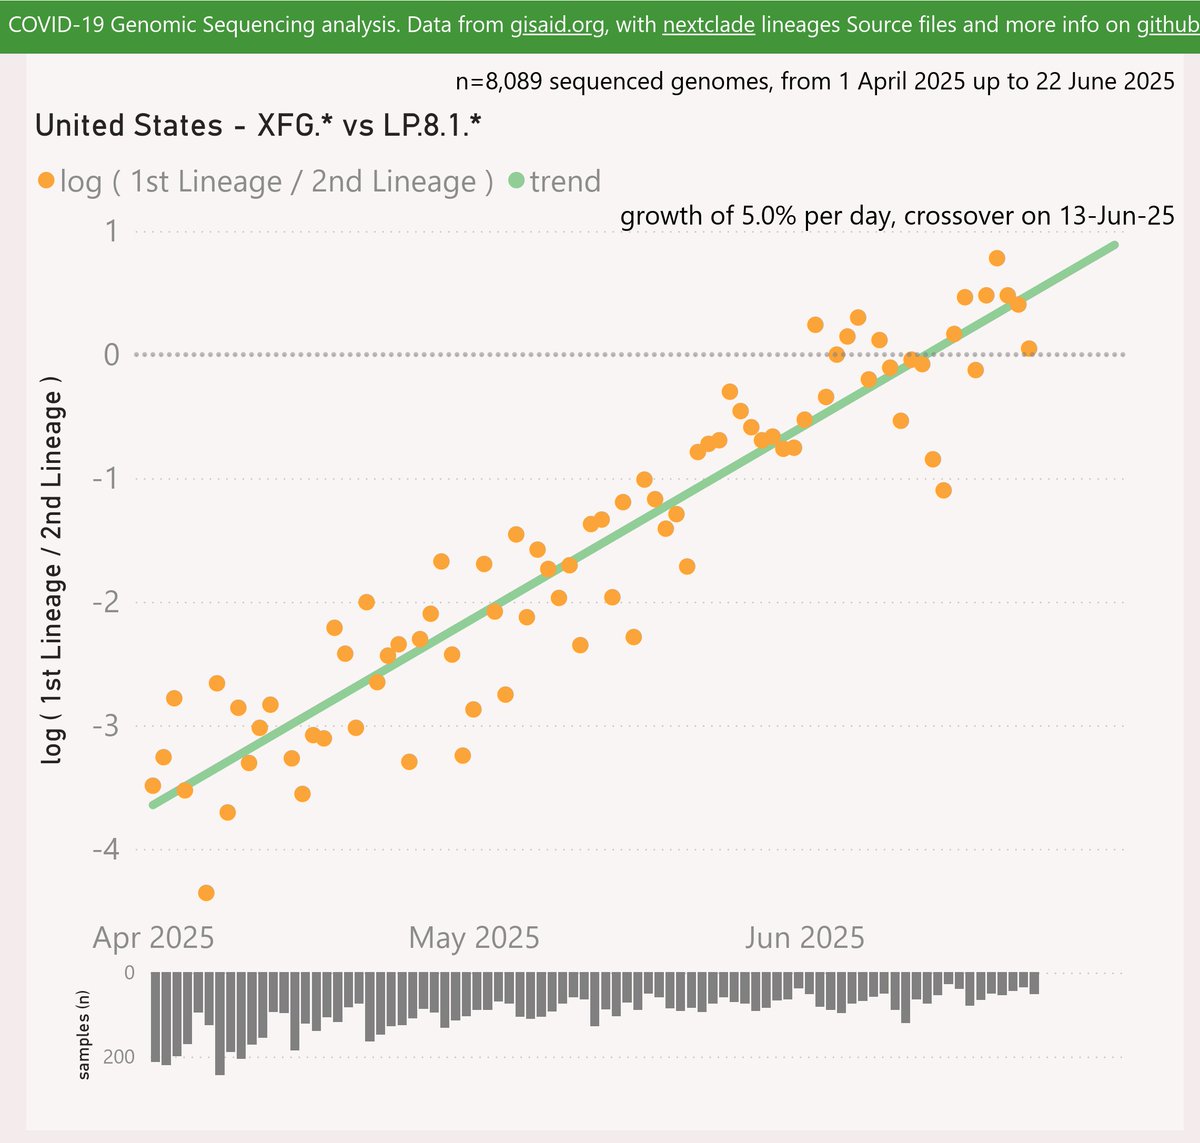
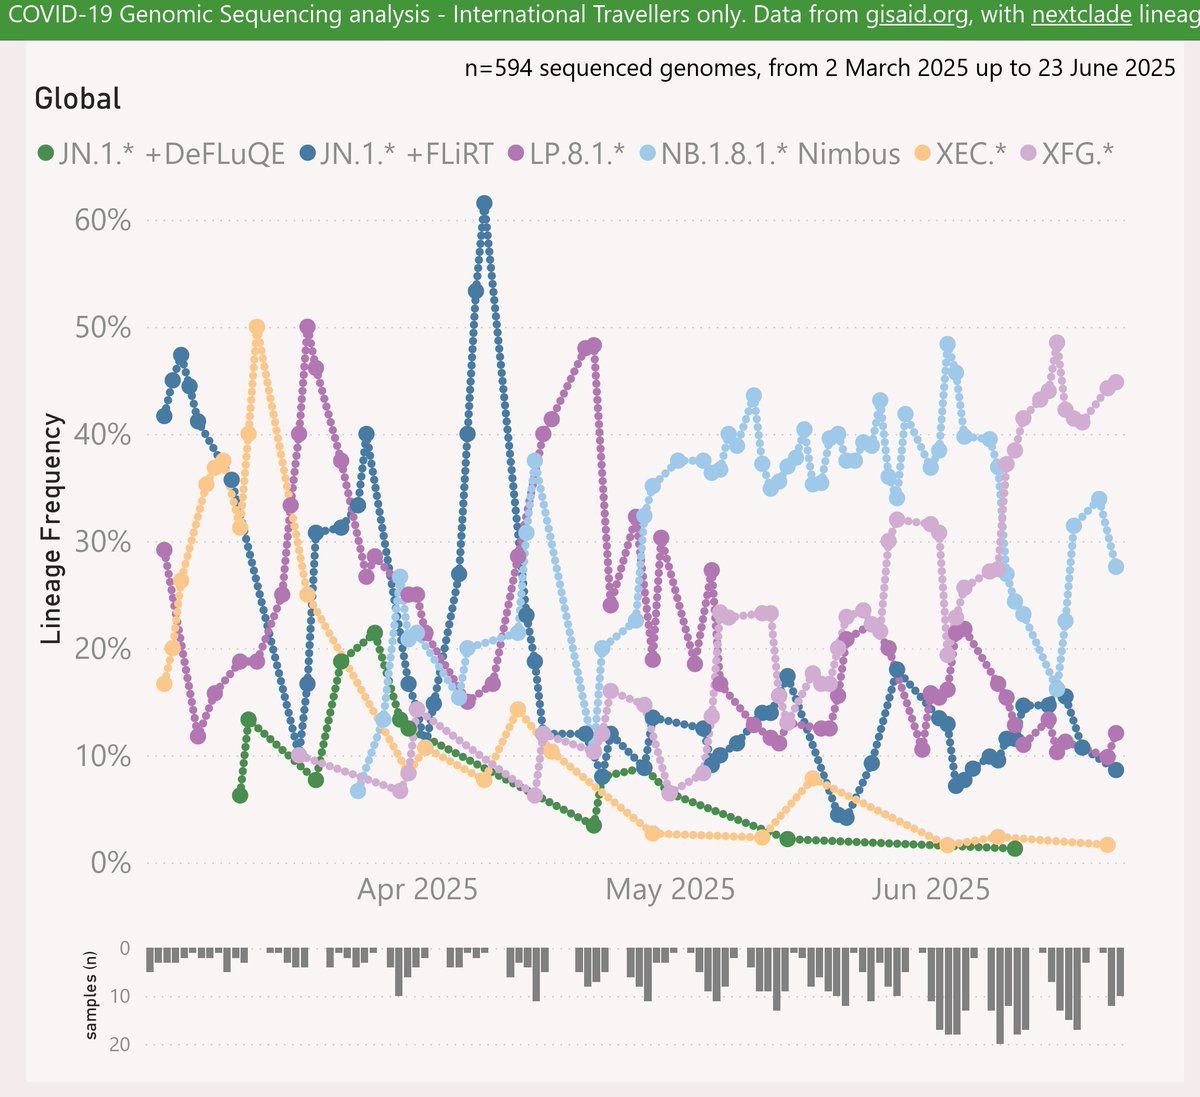
 Here are the trends across all the International Traveller samples. From that perspective, XFG.* "Stratus" is dominant at 48%.
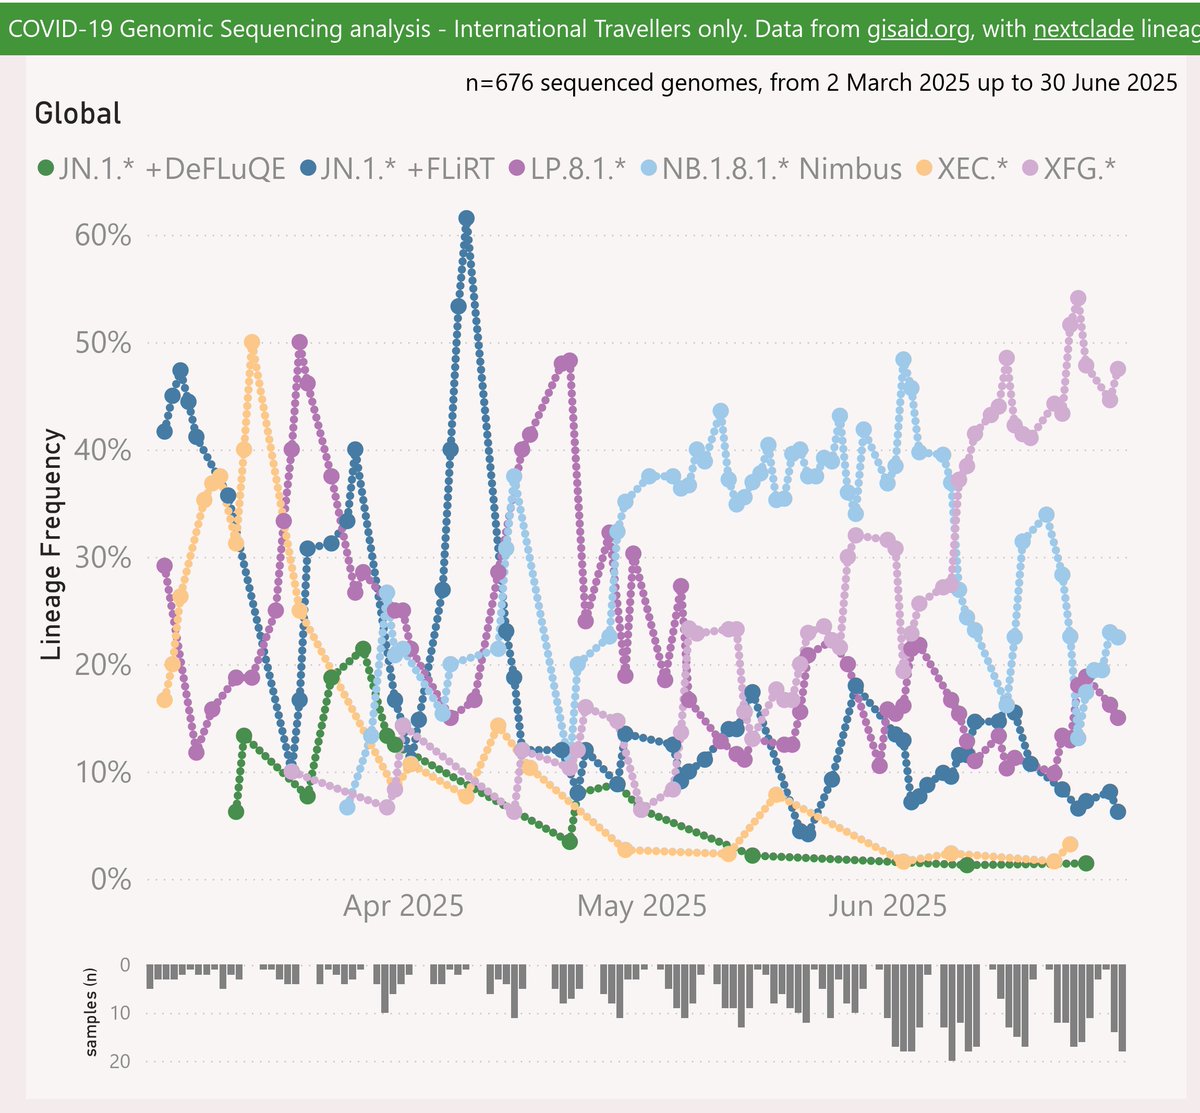
 The volatility is due to the ragged timing of submissions from various countries.
 Here are the trends across all the International Traveller samples. From that perspective, XFG.* "Stratus" is dominant at 45%.