
My talk: "Why Did (Almost) Nobody See It Coming and What Does That Mean for What’s Next?" from an ASSA inflation session w/ @JonSteinsson @GagnonMacro @jhausma1.
This short🧵summarizes. You can also watch the full discussion. dropbox.com/s/wcnttel1wvgf…
aeaweb.org/conference/202…
This short🧵summarizes. You can also watch the full discussion. dropbox.com/s/wcnttel1wvgf…
aeaweb.org/conference/202…
"Why did nobody see it coming" was stolen from the Queen's question after the financial crisis.
In some ways it is less important since inflation is much less bad than the global financial crisis.
In other ways it is more important: inflation *should* be more predictable.
In some ways it is less important since inflation is much less bad than the global financial crisis.
In other ways it is more important: inflation *should* be more predictable.

I think we know (almost) everyone missed it. More than a third of the way through the yr private-sector forecasters thought 2.3% and put the odds of 4%+ at 0.5% (it ended up 4.5%). FOMC just as bad. And TIPS breakevens missed the CPI by even more than either of them.

(The early errors were non-partisan. Kevin Hassett (Chair of Trump's CEA) full throatedly endorsed a $1.9T fiscal plan. @djheakin was strongly criticized it but for other reasons--and he dismissed predictions it would lead to overheating.)
My talk reviews three types of explanations for the failure to predict inflation:
1. Developments we didn't (or couldn't) expect
2. We didn't take our theories seriously enough
3. Something is missing/wrong with our theories
Will address these in turn.
1. Developments we didn't (or couldn't) expect
2. We didn't take our theories seriously enough
3. Something is missing/wrong with our theories
Will address these in turn.
1. DEVELOPMENTS WE DIDN'T (OR COULDN'T) EXPECT. People list three main ones. One is the Delta wave which many argued raised inflation by slowing the reopening of the economy. See Jay Powell for one of many, many examples of this argument.

But, notably many people--including Powell again--had made the opposite argument earlier in the year, attributing the rapid inflation in the spring to the fact that vaccinations were speeding the reopening of the economy.

One can construct stories under which both speeding up reopening is inflationary and also slowing down reopening is inflationary. But Occam's razor would beg to differ with many of them.
My best guess is, if anything, delta lowered inflation.
My best guess is, if anything, delta lowered inflation.
https://twitter.com/jasonfurman/status/1463518560068648962?s=20
Another candidate: the continued strength of goods & weakness of services. There is some question of whether this should have been unanticipated: it was not just delta, in fact mismatch grew in April/May/June as the virus receded. So maybe the predictable result of stimulus.

Regardless, while this rotation plausibly caused some excess inflation it is not obvious how much. You CANNOT do a counterfactual that reduces goods inflation without accounting for the fact that less rotation would have meant more services inflation.
https://twitter.com/jasonfurman/status/1470517232182734856?s=20
Finally, there are all the supply chain issues that get so much attention like semiconductors, commodity shortages, ports and the so-called great resignation.

These supply chain issues have gotten too much attention. Some are genuine supply disruptions (where COVID affects production) but most are actually a way of talking about increasing demand meeting relatively inelastic supply. Ports, where volumes are way up, being an example.

2. WE DIDN'T TAKE OUR THEORIES SERIOUSLY ENOUGH. I think a lot of the problem was that we didn't take our theories seriously enough, and in particular acted like monetary and fiscal policy don't matter or matter very little.
I did this chart shortly after the American Rescue Plan was proposed. It shows the expected trajectory for the economy (in Blue) and then what would happen as a result of the $2.8T passed in December and proposed for March.

I used two sets of multipliers:
1. "Normal multipliers" which were taken from CEA (originally Christy Romer), are similar to the FRB-US and IHS-Markit models, and the mid-point of previous CBO.
2. CBO's low multipliers assuming social distancing.
1. "Normal multipliers" which were taken from CEA (originally Christy Romer), are similar to the FRB-US and IHS-Markit models, and the mid-point of previous CBO.
2. CBO's low multipliers assuming social distancing.
Note, I'm not even showing CBO's previous "high multiplier" case which would be bigger than any of these. And I am showing CBO's low multiplier even though ex ante there was little reason to believe that spring 2020-level social distancing was the right assumption for 2021.
So the multipliers I'm showing are a range that, if anything, is well below what one could reasonably expect. Also, below the multipliers many--including myself & @BRamamurti46 used in advocating for more fiscal stimulus.
https://twitter.com/BharatRamamurti/status/1306713487306035202?s=20
OK, back to the numbers but now showing the exact same numbers/analysis but GDP relative to potential. This prediction was extraordinary: for 2021 Q2 and Q3 GDP would be 2 to 6 percent above potential.

For that to have happened something truly extraordinary would have needed to occur with the economy going from 4% below it's potential to 2-6% above its potential in just six months in the midst of a pandemic with all sorts of issues.
Absent an extraordinary burst of productivity growth hitting this forecast would have required the unemployment rate to have fallen to 1-3% in Q2 (using Okun's Law). Or else you would need a fudge factor of an extraordinary burst of productivity growth.
https://twitter.com/jasonfurman/status/1404440165569810434?s=20
So where does this leave us? Given this analysis our choices are:
1. Baseline much worse than shown
2. Fiscal policy doesn't matter much (real or nominal)
3. Very rapid redn in UR or rise in productivity
4. Excess inflation (most plausible, I'll return to it below)
1. Baseline much worse than shown
2. Fiscal policy doesn't matter much (real or nominal)
3. Very rapid redn in UR or rise in productivity
4. Excess inflation (most plausible, I'll return to it below)
The above all assumed CBO's pre-COVID projections for potential were reasonable. This ignores hysteresis. A combination of lower popln growth (especially immigration), missing capital investment and COVID disruption likely lowered potential, at least in 2021.

Hysterisis also shows up in the widespread misapplication of the Philips curve to predict inflation in 2021. 3.5% was a perfectly reasonable estimate of the NAIRU in April 2019. But in April 2021 it was, at least, temporarily higher because of what we had been through.

3. SOMETHING MISSING/WRONG WITH OUR THEORIES. The final category blurs with the previous in that everything I identify as missing/wrong with our theories was understood/appreciated by some ex ante. But none of it got nearly as much attention so I'm bucketing all of them here.
The first major issue here is that the large majority of slack analysis almost exclusively used the unemployment rate. In April 2021 the unemployment rate was elevated (and prime age EPOP even more elevated). But job openings were high and quits were sky high.

There are issues with using job openings (not clear how intensely employers trying to fill them) & quits (distorted by pandemic reallocation shock). But also issues with unemployment (search intensity varies) and employment rates (institutional/cultural participation shifts).
Using data from before the pandemic it seems as, if anything, quits were the best predictors and job openings second best. So were worth taking them more seriously in real time, the few who were realized the hot labor market a few months before others did.
https://twitter.com/jasonfurman/status/1462944120570359811?s=20
(BTW, since April the unemployment rate has fallen so sharply that it is now telling the same story as job openings but the quits rate is still telling an off-the-charts red hot labor market story.)

A second thing that was missing/wrong with our theories is that we thought of our multiplier models as describing real GDP. But what if they were all about nominal GDP??? Telling us how much people would increase their spending in response to low interest rates, transfers, etc.
So the 2-6% above potential GDP is about nominal GDP.
Then ask how much can real GDP rise? Probably not all the way to potential right away. Get some extra productivity and employment but...
The residual between desired higher spending & constrained supply is inflation.
Then ask how much can real GDP rise? Probably not all the way to potential right away. Get some extra productivity and employment but...
The residual between desired higher spending & constrained supply is inflation.

This simple framework is equivalent to policy hitting a range where supply is inelastic. Clearly an oversimplification. But when you're pushing so hard/fast that oversimplification is probably closer to true than most anything else.
Is easier to raise prices than production.
Is easier to raise prices than production.
In sum, unanticipated developments may have been part of the story for inflation in 2021 but unlikely a large part.
The bigger issue was failing to believe that fiscal policy actually works and matters. And failing to look at a broader range of labor market indicators.
The bigger issue was failing to believe that fiscal policy actually works and matters. And failing to look at a broader range of labor market indicators.
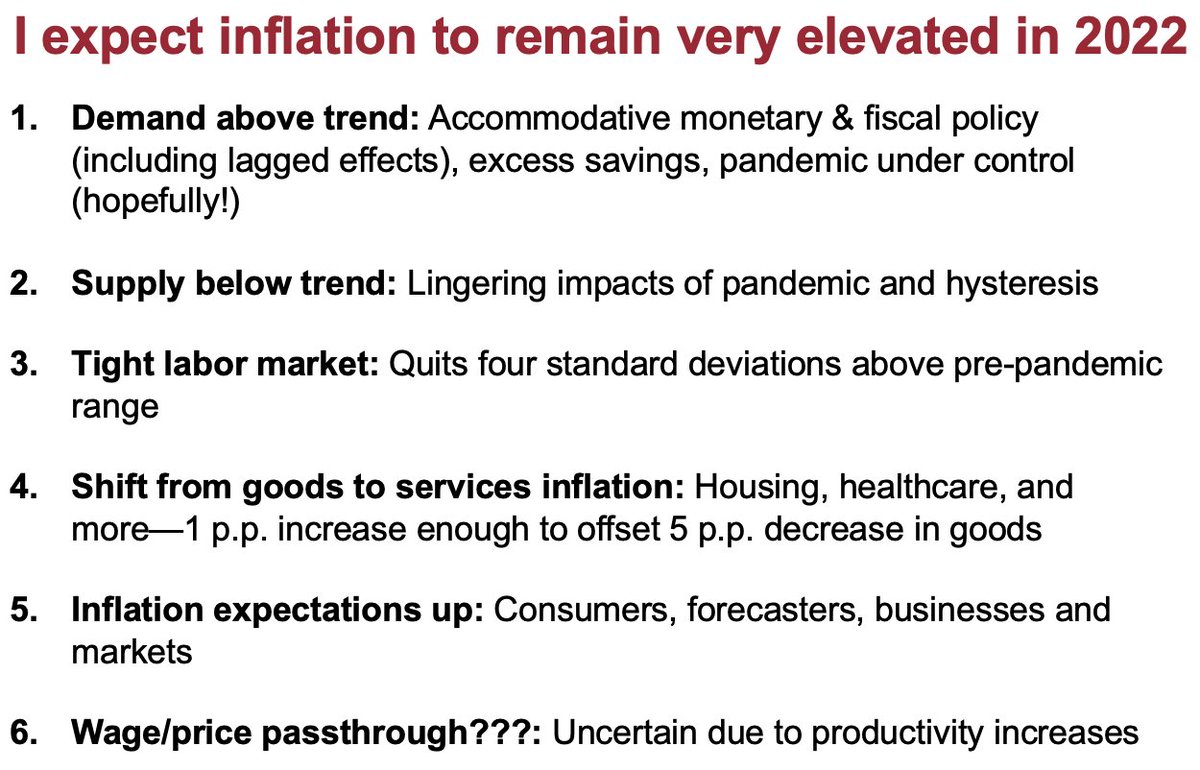
Going forward, I expect inflation to remain very elevated in 2022 for several reasons I've elaborate on more elsewhere and are summarized in this slide.
During the session I gave my own highly subjective probability distribution for 2022 core PCE inflation.
For context, the Fed staff is at 2.1% (for overall PCE), the FOMC median is 2.7% and the SPF is 2.3%.
So I'm well above those.
For context, the Fed staff is at 2.1% (for overall PCE), the FOMC median is 2.7% and the SPF is 2.3%.
So I'm well above those.

Listening to the discussion in the session I updated my highly subjective projection a little. In particular, I think inflation will *likely* be lower in 2022 than in 2021 but I upped the odds that the inflation rate rises to something more like 20 percent.

Sorry for yet another long thread but congratulations on reaching the end of it and I hope you got something out of it. Here again are links to my slides and the session video. FIN dropbox.com/s/wcnttel1wvgf… aeaweb.org/conference/202…
• • •
Missing some Tweet in this thread? You can try to
force a refresh


