
A Mega Thread on RELATIVE STRENGTH
A method to improve
Stock Selection and Conviction in trades
Retweet 🔄And Follow
@JayneshKasliwal
A method to improve
Stock Selection and Conviction in trades
Retweet 🔄And Follow
@JayneshKasliwal
What is RELATIVE STRENGTH?
Relative strength is a strategy used in momentum investing and in identifying value stocks.
It focuses on investing in stocks or other investments that have performed well relative to the market as a whole or to a relevant benchmark.
1/n
Relative strength is a strategy used in momentum investing and in identifying value stocks.
It focuses on investing in stocks or other investments that have performed well relative to the market as a whole or to a relevant benchmark.
1/n
For example, a relative strength investor might select technology companies that have outperformed the Nifty50, or the Nifty 500.
This is basically used for Identifying the strongest sector , stocks , asset class by comparing the relative performance
2/n
This is basically used for Identifying the strongest sector , stocks , asset class by comparing the relative performance
2/n
How to apply it in tradingview?
Type
“Relative Strength”
Choose any
By bharattrader
By traderlion
By Modhelius
I use by bharattrader
In setting use 65 period
3/n
Type
“Relative Strength”
Choose any
By bharattrader
By traderlion
By Modhelius
I use by bharattrader
In setting use 65 period
3/n


Formula for Rs
Using 65 as period and base as NiftyOne can use 123 or 250 as period depending upon your time frame of holding
If your view is short term then 65 works great and mid to long term can use 123 and 250 .
@kuttrapali26
4/n
Using 65 as period and base as NiftyOne can use 123 or 250 as period depending upon your time frame of holding
If your view is short term then 65 works great and mid to long term can use 123 and 250 .
@kuttrapali26
4/n

Why to Use RS ?
Helps to filter out stocks in good momentum and that are giving better returns than nifty
These stocks tend to outperform the market.
These are potentially superstocks
65 period signifies 3 months of trading
In 3 months we have around 65 trading days
5/n
Helps to filter out stocks in good momentum and that are giving better returns than nifty
These stocks tend to outperform the market.
These are potentially superstocks
65 period signifies 3 months of trading
In 3 months we have around 65 trading days
5/n
How does RELATIVE STRENGTH look ?
0 line that helps to differentiate between underperformer and outperformer
>1 Outperforming the markets
<0 Underperforming the markets
When 65 RS Goes above 2 its too much heated and generally goes into consolidation or pullback
@vivbajaj
6/n
0 line that helps to differentiate between underperformer and outperformer
>1 Outperforming the markets
<0 Underperforming the markets
When 65 RS Goes above 2 its too much heated and generally goes into consolidation or pullback
@vivbajaj
6/n

Simple Example of Relative Strength
Nifty Falling 10% but your Stock is not falling and staying sideways Means it has Strength to fight against the falling market.
When Market Recovers it already had strenght and hence it will moe more faster
7/n
Nifty Falling 10% but your Stock is not falling and staying sideways Means it has Strength to fight against the falling market.
When Market Recovers it already had strenght and hence it will moe more faster
7/n

Ways To Use RS
Most Popular - Stock vs Index
(Example – Reliance Vs Nifty 50)
Stock Vs Stock in same sector
(Example –LTI Vs Infy)
Stock Vs Stock across sectors
(Example –Reliance Vs TataMotors)
LTI
Comparing IT stock vs NIFTY vs IT index
8/n
Most Popular - Stock vs Index
(Example – Reliance Vs Nifty 50)
Stock Vs Stock in same sector
(Example –LTI Vs Infy)
Stock Vs Stock across sectors
(Example –Reliance Vs TataMotors)
LTI
Comparing IT stock vs NIFTY vs IT index
8/n

Local Index Vs Global Index
(Example – NIFTY50 vs S&P 500)
Relationship across sectors
(Banking vs Telecom)
Relationship across asset classes
(Gold Vs Dow)
Relationship across segments of the market
(Mid-cap index vs Small cap index)
9/n
S&P500 Vs Nifty
(Example – NIFTY50 vs S&P 500)
Relationship across sectors
(Banking vs Telecom)
Relationship across asset classes
(Gold Vs Dow)
Relationship across segments of the market
(Mid-cap index vs Small cap index)
9/n
S&P500 Vs Nifty

NIFTY INFRA vs NIFTY 50 VS NIFTY psu
The Highlighted part means that
Nifty Infra is outperforming the nifty 50 index in that period but underperforming the Psu bank index
That indirectly means that psubanks have outperformed both nifty and nifty infra and hence is the strongest
The Highlighted part means that
Nifty Infra is outperforming the nifty 50 index in that period but underperforming the Psu bank index
That indirectly means that psubanks have outperformed both nifty and nifty infra and hence is the strongest

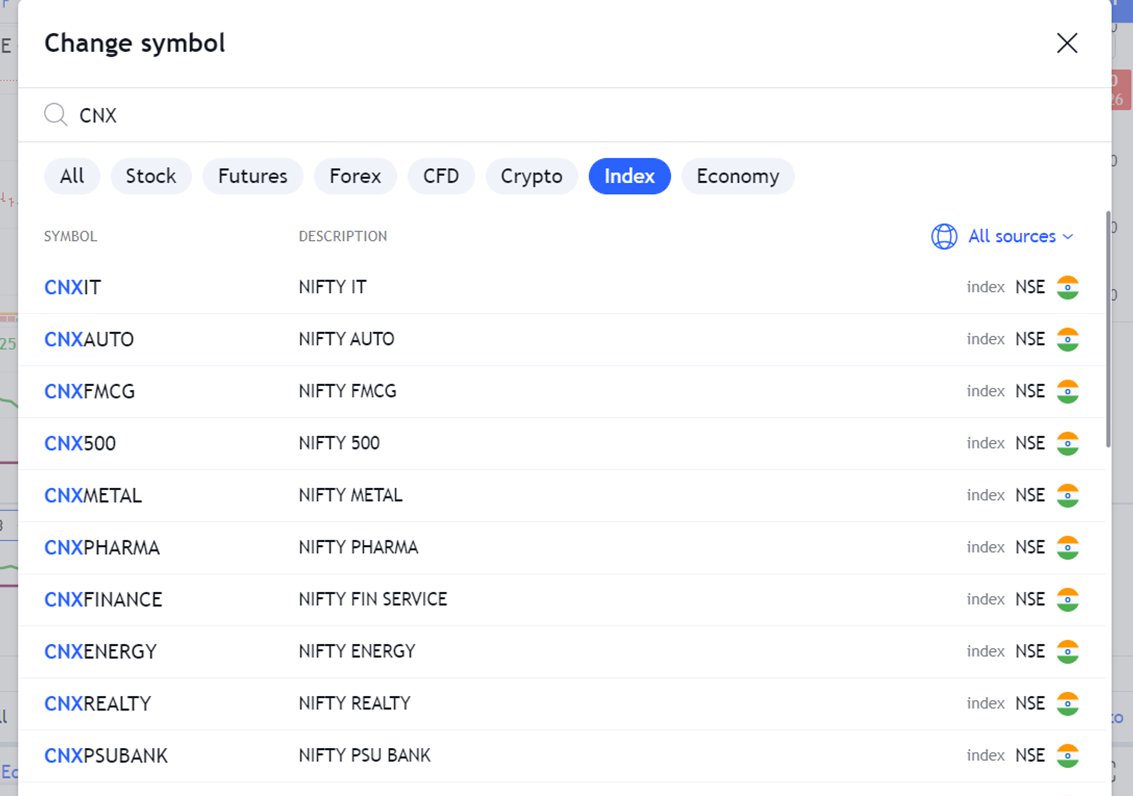
You can Compare any Asset with any other asset by changing the comparative symbol
You can use CNX IT , PHARMA , INFRA to compare your stocks to specific Sector
11/n
You can use CNX IT , PHARMA , INFRA to compare your stocks to specific Sector
11/n

Outperformance Vs Underperformance
JSLHISAR vs AMARRAJA BATTERY
12/n
JSLHISAR vs AMARRAJA BATTERY
12/n


Extended >2: Stock Correct
Extended >2 Stock turns Sideways
Globus Spirits Vs Goodluck
13/n
Extended >2 Stock turns Sideways
Globus Spirits Vs Goodluck
13/n


Points to remember :
Key point: Relative Strength tends to select high beta or low beta stocks, depending on the market trend.
When that trend undergoes a major reversal, Relative Strength will see its peak underperformance.
Because tops and bottoms are sharp and quick.
14/n
Key point: Relative Strength tends to select high beta or low beta stocks, depending on the market trend.
When that trend undergoes a major reversal, Relative Strength will see its peak underperformance.
Because tops and bottoms are sharp and quick.
14/n
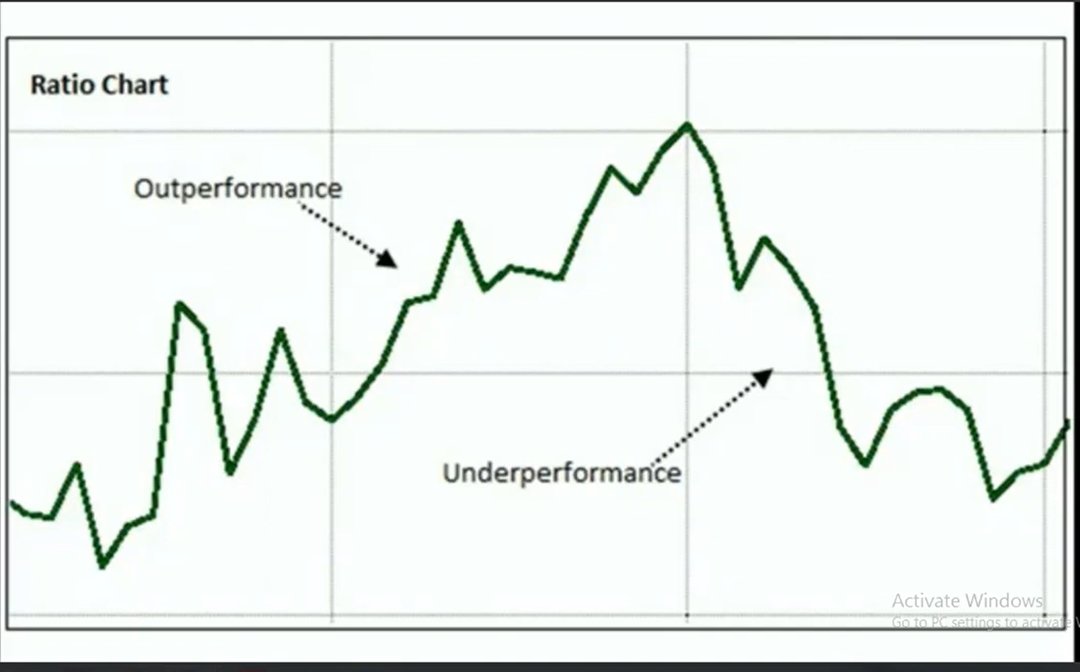
Different Type of Relative strength
COMPARATIVE RELATIVE STRENGTH
One can Simply divide Stock Price by Index Price
This is known as ratio chart
15/n
COMPARATIVE RELATIVE STRENGTH
One can Simply divide Stock Price by Index Price
This is known as ratio chart
15/n

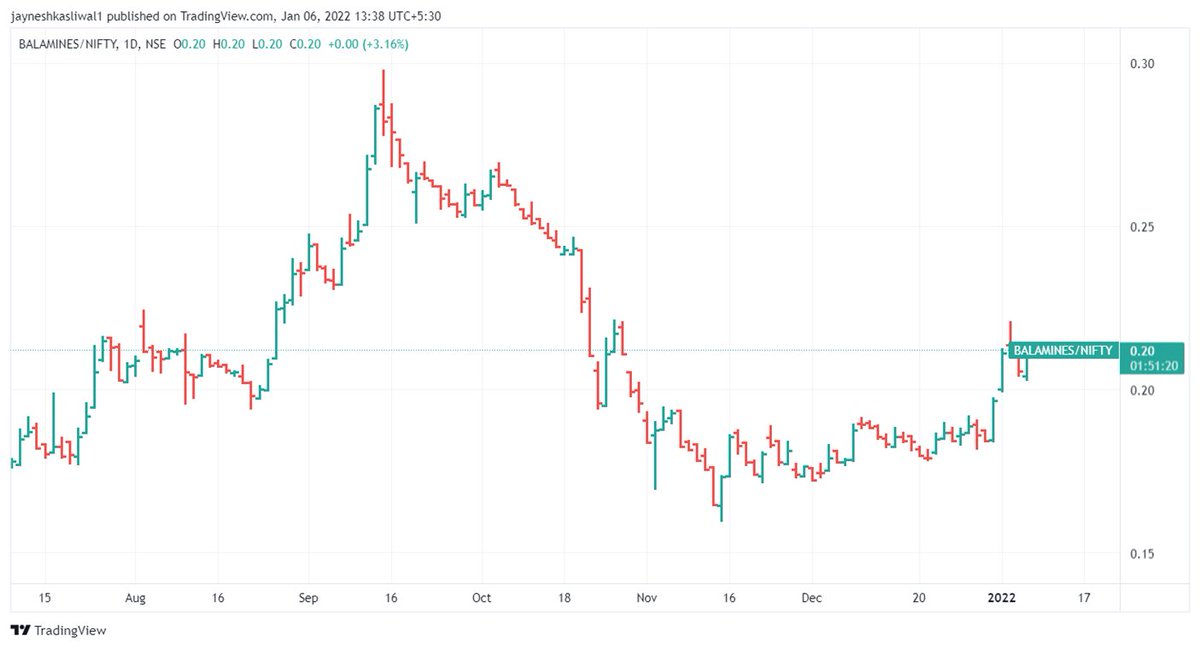
In tradingView
use "/" Symbol to plot the ratio chart in symbol search
Reliance vs BalajiAmines
16/n
use "/" Symbol to plot the ratio chart in symbol search
Reliance vs BalajiAmines
16/n


Understanding the trend
17/n
17/n

Difference between RS vs CRS
The RS calculates the relationship between price of the past “N” period in our case 65
The CRS calculates the relation on daily basis price change and plots
CRS will show you the trend of the particular day while RS shows you trend of past 65 days
18
The RS calculates the relationship between price of the past “N” period in our case 65
The CRS calculates the relation on daily basis price change and plots
CRS will show you the trend of the particular day while RS shows you trend of past 65 days
18
Simpler Explanation
Example 1
Nifty Falls 10 % over a period but a stock a stock gains 10% . What does that mean ?
Nifty Stays Flat over a period but a stock gains 10% . What does that mean ?
Nifty Rises 10% over a period but your stock Rises 50% .
What does that mean ?
19/n
Example 1
Nifty Falls 10 % over a period but a stock a stock gains 10% . What does that mean ?
Nifty Stays Flat over a period but a stock gains 10% . What does that mean ?
Nifty Rises 10% over a period but your stock Rises 50% .
What does that mean ?
19/n
ANS :
Buyers are still interested in the stock/ Sellers are weak and when market recovers these are the stocks which move Ahead much faster as they already have strength .
Stocks that are showing strength in weak market will outperform in strong market
20/n
Buyers are still interested in the stock/ Sellers are weak and when market recovers these are the stocks which move Ahead much faster as they already have strength .
Stocks that are showing strength in weak market will outperform in strong market
20/n

CASE STUDYS
NIFTY Fallen 11% from highs
CHAMBALFERT : Stays Flat
MANINFRA : Up 22% in weak market
PVR : Falls More than 25%
21/n
NIFTY Fallen 11% from highs
CHAMBALFERT : Stays Flat
MANINFRA : Up 22% in weak market
PVR : Falls More than 25%
21/n


CASE STUDY LIVE
Screenshot From Telegram channel
Technical Test given to followers to select the best stock
A) outperformer as + RS
B) and C) At support and hence most chose that as an answer as swing trading bet
Over the next 10 days
A) JSL HISAR gave a + Return of 18%
22/n
Screenshot From Telegram channel
Technical Test given to followers to select the best stock
A) outperformer as + RS
B) and C) At support and hence most chose that as an answer as swing trading bet
Over the next 10 days
A) JSL HISAR gave a + Return of 18%
22/n

Immediately the stock A) gave 6%+ Returns while other stocks closed in red
Even though a stock is trading at support doesn’t means its bound to rise
A stock with Positive RS will move faster than a stock with –Ve RS
That is OUTPERFORMANCE we are talking about
23/n
Even though a stock is trading at support doesn’t means its bound to rise
A stock with Positive RS will move faster than a stock with –Ve RS
That is OUTPERFORMANCE we are talking about
23/n

Join free telegram
t.me/Techno_charts
Join Paid Group for free 1 day : app.cosmofeed.com/view_group/619…
t.me/Techno_charts
Join Paid Group for free 1 day : app.cosmofeed.com/view_group/619…
• • •
Missing some Tweet in this thread? You can try to
force a refresh


