
THREAD
#MiddleEastRainEvent2 Status Update:
Image below shows the situation as at roughly 2pm AST/EAT. A large storm with a line of thunderstorms sits over Saudi Arabia heading North East towards Iraq.
Quoted Tweet shows video from near Medina

#MiddleEastRainEvent2 Status Update:
Image below shows the situation as at roughly 2pm AST/EAT. A large storm with a line of thunderstorms sits over Saudi Arabia heading North East towards Iraq.
Quoted Tweet shows video from near Medina
https://twitter.com/Arab_Storms/status/1480445382165286913?s=20

It has been a big night of storms, with a large storm over Medina for several hours. This morning it has also been raining in the Prophet's home town.
These two video gifs are from the live stream broadcast continuously of Al-Masjid an-Nabawi / المسجد النبوي.
You can find out more here >> en.wikipedia.org/wiki/Al-Masjid…
& watch live here >> makkahlive.net/madinalive.aspx
You can find out more here >> en.wikipedia.org/wiki/Al-Masjid…
& watch live here >> makkahlive.net/madinalive.aspx
This animation shows 18hours of rainfall over the region. As you can see Iraq and Jordan, two countries which have been facing very severe droughts received the most generous portions of last nights rain. The Area where NEOM is located also looks to have received lots.
This is a 24 hour visual animation of satellite imagery from @zoom_earth of the beginning of this latest active phase in the event.
This animation shows six hours this part of the atmospheric river is heading due north towards the end gradually curving to the left guided by the storm over the Mediterranean.
This wide angle view shows that storm which is moving very slowly if at all currently off the coast of Libya near Bhengazi (we will look at it in more detail shortly) - and which is playing a very big role in this event.
On LHS there is a large atmospheric river making landfall.
On LHS there is a large atmospheric river making landfall.

This 12 hour animation of the broader picture helps us see what is going on as we can see how the elements are interacting. There are two low pressure circulations over the Eastern Med for e.g.
Two large water flow mechanisms are invisible as they aren't producing clouds.
Two large water flow mechanisms are invisible as they aren't producing clouds.
Fortunately we can complete the picture using the simulation data. This is a simulation from 8th Jan of the water transport data - Wind, Atmospheric Moisture and and MLSP (isobars). Its a bit difficult to read though.
Looking into the detail at 0 hour data we can see what the models thought the situation was in real time as they initiated their simulations. Here we can see what was happening in terms of West Africa /Atlantic Monsoon flows yesterday.
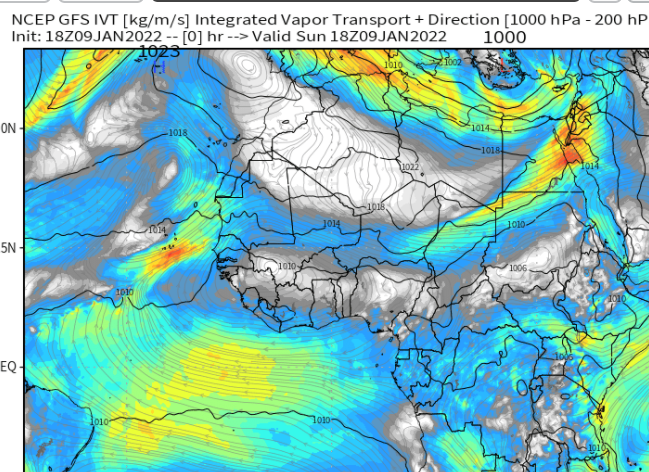
There is a continuous stream across the Aahara from Senegal to Sudan, but not all of it is moving fast and most of it is not moving east at all, its being recycled back into the Atlantic over Western Sahara.


This is this morning's 6am 0 hour reading from the GFS3 Model. I have 3 questions.
1. What is happening in the Great African Equatorial Forest Area/Gulf of guinea?
2. What is happening with the storm in the Med?
3. What is the role of the East African monsoon, NW Indian Ocean?
1. What is happening in the Great African Equatorial Forest Area/Gulf of guinea?
2. What is happening with the storm in the Med?
3. What is the role of the East African monsoon, NW Indian Ocean?

And a fourth.
4. Is there a new strong water impulse coming in from the Amazon as indicated in the satellite imagery. To which the answer is yes,
4. Is there a new strong water impulse coming in from the Amazon as indicated in the satellite imagery. To which the answer is yes,

Q1. What is happening in the Great African Equatorial Forest Area/Gulf of guinea?
A: Whilst satellite imagery of this is very pretty the direction of flow of most water in this area is very strongly westward.
A: Whilst satellite imagery of this is very pretty the direction of flow of most water in this area is very strongly westward.
https://twitter.com/althecat/status/1480241961135222792


Q2. What is happening with the storm in the Med?
Here's a satellite image of the last 12 hours. It shows the storm (bottom left) which brought snow to Tunisia on 8 Jan (quoted tweet). The rest is far from clear there is clearly more than 1 low pressure system though.
Here's a satellite image of the last 12 hours. It shows the storm (bottom left) which brought snow to Tunisia on 8 Jan (quoted tweet). The rest is far from clear there is clearly more than 1 low pressure system though.
A 24 hour long version is not much more helpful. Note that on @Zoom_earth you can look at this in a great deal more detail & share.
Jan 10, 2:15 PM | Zoom Earth zoom.earth/#view=42.8,22.…
Jan 10, 2:15 PM | Zoom Earth zoom.earth/#view=42.8,22.…
This is a 24 hour simulation of what we see above. Which tells us more. There are three lows in there, and the most important of these appears to be the one in the rear as its the deepest (994 vs 1001-Bhengazi and 1002-Bospherous Straits).
It shows some recycling of the water which is passing through the levant underway. And we also know it is cold as it is travelling southwards - which is why it is important. And we can see the lows are curling the path of Atlantic water flow and sending it north over Ukraine.

And it also suggests flooding is possible in South West France. For which a warning has been issued. I am further north in Brittany, where it is not very cold, and raining, thanks to this atmospheric river. connexionfrance.com/French-news/Al…
Using the model data we can also check the accuracy of the forecast. On the left is the forecast of what we see on the right from three dats ago.
The storm is more organised than it was expected to be and 4mb stronger - which is quite a lot.
The storm is more organised than it was expected to be and 4mb stronger - which is quite a lot.


Note also the water transport energy readings over the North sea and North Africa. These are also significant.
We can also se what the model thinks will happen next (latest run). The storm is still expected to disintegrate as it comes into contact with the North Africa Coast.
But by then its work will have been done, dragging quantities of cold air and moisture from the North Atlantic all to Egypt and the Levant where its is now colliding with a atmospheric river from the Amazon which is being reinforced by the East Africa Monsoon.
Q3. What is the role of the East African monsoon & NW Indian Ocean?
Because the answer to Question 1. was "No". we need to understand where the additional water comes from which powers the major phase of this event from 13th to 18th January.
Because the answer to Question 1. was "No". we need to understand where the additional water comes from which powers the major phase of this event from 13th to 18th January.
https://twitter.com/althecat/status/1480523764651552768?s=20
This is another 72 hour simulation forecast. Of PWAT anomaly. And in simple terms the question is, if the water which makes the blue blob on the right grow over the next three days doesn't come from the Great Equatorial Monsoon, then where does it come from?
This image overlays the rough boundaries and size of the massive area significantly higher than normal atmospheric water for this time of year (vs climate norms) is expected to occupy, prior to the major phase beginning on the night of Jan 13-14th.

Part of the reason that this event is forecast to last so long (and be so dangerous as a result) is that the second blob you see in the earlier PWAT Anom animation (the one on the left) - arrives in the ME in several days time, providing an additional burst of energy/water.
The above animation shows the current forecast for 213 hours through to the forecast end of the event on 19th January. This animation of IVWT (now my favourite @WeatherModels_ chart) shows the period to the 14th - and the beginning of the forecast major event.
@weathermodels_ That animation is again not that helpful, but it illustrates the main point. These two plots are for the same point in time - 3pm tomorrow. Over the next 24 hours the direction of the Sahara plume moves from North East to East, sending moisture towards the UAE rather than Iraq.


This stream then recycles itself, travelling in a loop over SE over the Gulf, Iran, south over the Empty Quarter, the UAE and Oman the inside of the loop travels back up the Red sea while the outer bands move down the Somali coast turning West over Kenya and then north west.


This cluster of lows is indicative of an unstable atmosphere and the Cape Index plot for the same period indicates that there is also a peak unstable period at this time to the south over the DRC. This should produce large thunderstorms.


And the high altitude moisture from these thunderstorms will be picked up by these highspeed Jetstream winds .
If you look closely there is a deviation in these winds south over CAR and which turns back north over Sudan.
All this should be fairly obvious in satellite imagery.
If you look closely there is a deviation in these winds south over CAR and which turns back north over Sudan.
All this should be fairly obvious in satellite imagery.


Interestingly this water recycling/transit activity is not expected to result in very much rain by the models, except in the highlands of Ethiopia. We shall see..
الله أعلم
ENDS
@Threadreaderapp Unroll
الله أعلم
ENDS
@Threadreaderapp Unroll


• • •
Missing some Tweet in this thread? You can try to
force a refresh


