NOAA NCEI Profile picture
Jan 10, 2022 10 tweets 8 min read Read on X
We have just released the 2021 Annual U.S. Climate Report. Follow this thread for details, and read more online: bit.ly/USClimate202112 #StateOfClimate Map of US with NCEI logo with text "2021 Annual U.S. Cl
The 2021 contiguous U.S. average temperature was 54.5°F, 2.5°F above average, the fourth-warmest year on record. bit.ly/USClimate202112 #StateOfClimate 2021 Mean Temperature Departure from Average U.S. Map
RECORD WARM FOR THE MONTH: December contiguous U.S. temperature was 39.3°F, 6.7°F above average, exceeding the previous record set in December 2015. bit.ly/USClimate202112 #StateOfClimate Map of December 2021 U.S. Statewide Average Temperature Rank
The 2021 contiguous U.S. precipitation total was 30.48 inches, 0.54 inch above average, and ranks in the middle third of the record. bit.ly/USClimate202112 #StateOfClimate 2021 U.S. Total Precipitation Percentiles Map
For 2021, the county with the greatest average precipitation in the contiguous U.S. was Jefferson County, WA, with 125.14 inches of precipitation. bit.ly/USClimate202112 #StateOfClimate 2021 U.S. County Precipitation Rank Map
The U.S. experienced 20 #BillionDollarDisasters in 2021: 8 severe weather events, 4 tropical cyclone events, 3 tornado outbreaks, 2 flooding events, 1 drought/heat wave event, 1 winter storm/cold wave event, and 1 wildfire event. bit.ly/USClimate202112 #StateOfClimate U.S. 2021 Billion-Dollar Weather and Climate Disasters Map
The U.S. disaster costs for 2021 exceeded $145 billion, which is the third-highest cost on record. bit.ly/USClimate202112 #StateOfClimate #BillionDollarDisasters U.S. 2021 Billion-Dollar Weather and Climate Disasters
During 2021, 21 named storms formed in the North Atlantic Basin. This was the third most-active Atlantic hurricane season on record. Above-average tropical activity across the Atlantic Basin occurred for the sixth year in a row. bit.ly/USClimate202112 #StateOfClimate Map of 2021 North Atlantic Hurricane Tracks
It was an active wildfire year across the western U.S. with more than 7.1 million acres consumed. The second-largest fire in California history, the Dixie Fire, consumed nearly 964,000 acres in 2021. bit.ly/USClimate202112 #StateOfClimate #CAwx #COwx U.S. Selected Significant Climate Anomalies and Events for 2
The 2021 preliminary U.S. tornado count was above average at 1,376 tornadoes. 193 December tornadoes have been confirmed — the greatest number of tornadoes for any December and nearly double the previous record of 97 in 2002. bit.ly/USClimate202112 #StateOfClimate

• • •

Missing some Tweet in this thread? You can try to force a refresh
 

Keep Current with NOAA NCEI

NOAA NCEI Profile picture

Stay in touch and get notified when new unrolls are available from this author!

Read all threads

This Thread may be Removed Anytime!

PDF

Twitter may remove this content at anytime! Save it as PDF for later use!

Try unrolling a thread yourself!

how to unroll video
  1. Follow @ThreadReaderApp to mention us!

  2. From a Twitter thread mention us with a keyword "unroll"
@threadreaderapp unroll

Practice here first or read more on our help page!

More from @NOAANCEI

Oct 24
Our data and products are coming back online as NCEI recovers from Hurricane Helene, so we’re releasing an abbreviated version of our September U.S. and Global climate stats. Follow this thread for more. #StateOfClimate bit.ly/ClimateReports…A rain-swollen Reems Creek in Weaverville, NC in the aftermath of Hurricane Helene. The remnants of a red water wheel and other debris lie along the side of the falls.
The average temperature of the contiguous U.S. in September was 68.6°F, 3.8°F above average, ranking second warmest in the 130-year record. #StateOfClimate bit.ly/ClimateReports…The average temperature of the contiguous U.S. in September was 68.6°F, 3.8°F above average, ranking second warmest in the 130-year record. https://bit.ly/ClimateReports202409 #StateOfClimate
The September global surface temperature was 2.23°F (1.24°C) above the 20th-century average of 59.0°F (15.0°ºC)—the second-warmest September on record. #StateOfClimate bit.ly/ClimateReports…Global map of Surface Temperature Departure from the 1991–2020 Average for September 2024 (°C) with warmer areas in gradients of red and cooler areas in gradients of blue.
Read 5 tweets
Aug 8
🤓 Learn more about significant U.S. weather and climate events and how they compare to the historical record: #StateOfClimate bit.ly/USClimate202407
Visible satellite image of the Northern Hemisphere on a dark background with text “U.S. Climate Report July 2024 NOAA National Centers for Environmental Information (NCEI)” and the NOAA logo.
July contiguous U.S. average temperature was 75.7°F, 2.1°F above average, ranking 11th warmest in the 130-year record: #StateOfClimate bit.ly/USClimate202407
Map of the U.S. showing temperature departures from average for July 2024 with warmer areas in gradients of red and cooler areas in gradients of blue.
July contiguous U.S. precipitation total was 3.04 inches, 0.26 inch above average, ranking in the wettest third of the historical record: #StateOfClimate bit.ly/USClimate202407
Map of the U.S. showing precipitation percentiles for July 2024 with wetter areas in gradients of green and drier areas in gradients of brown.
Read 7 tweets
Sep 14, 2023
RELEASED: Global Climate Report for August 2023. Learn more about significant global weather and climate events and how they compare to the historical record: #StateOfClimate bit.ly/Global202308
Visible satellite image of the northern Pacific Ocean on a dark background with text “August 2023 Global Climate Report NOAA National Centers for Environmental Information (NCEI)” and the NOAA emblem.
🌡️ At 2.25°F (1.25°C) above average, the August 2023 global temperature ranked as the warmest on record in August for the planet.

⚠️ Global temperature was 0.52°F (0.29°C) above the previous record from August 2016. #StateOfClimate bit.ly/Global202308
Map of the world showing land/ocean temperature percentiles for August 2023 with warmer areas in gradients of red and cooler areas in gradients of blue.
🌎 Global ocean surface temperature was the highest on record for the fifth consecutive month.
#StateOfClimate bit.ly/Global202308
Map of the world showing land/ocean temperature departures from average for August 2023 with warmer areas in gradients of red and cooler areas in gradients of blue.
Read 9 tweets
Jun 8, 2023
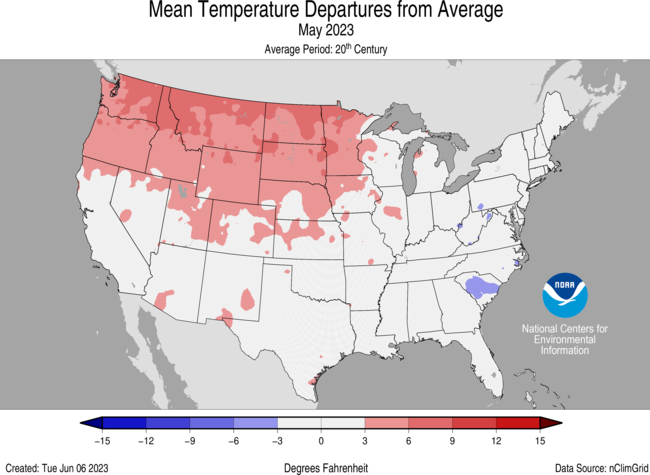
🤓 Learn more about significant U.S. weather and climate events and how they compare to the historical record: bit.ly/USClimate202305 #StateOfClimate Visible satellite image of ...
May contiguous U.S. average temperature was 62.4°F, 2.2°F above average—ranking 11th warmest in the 129-year record: bit.ly/USClimate202305 #StateOfClimate Map of the U.S. showing tem...
🥀 May contiguous U.S. precipitation total was 2.56 inches, 0.35 inch below average—ranking in the driest third of the record: bit.ly/USClimate202305 #StateOfClimate Map of the U.S. showing pre...
Read 7 tweets
Dec 20, 2021
1/7
The State Climate Extremes Committee has verified a new Tennessee 24-hour precipitation record of 20.73”, measured in McEwen, TN on August 21, 2021. Follow this thread for more on the new record. bit.ly/McEwenTNRecord @NWSNashville @NWSSouthern Aerial view of floodwaters ...
2/7
On August 21, 2021, several rounds of heavy thunderstorms impacted western Middle Tennessee. Deadly flash flooding devastated Waverly, TN, and the wastewater treatment plant in McEwen, TN recorded a stunning 20.73” of rainfall in under 24 hours. bit.ly/McEwenTNRecord Damaged car filled with flo...
3/7
The McEwen site is “non-network,” so it isn’t part of a formal weather observation network. Confirmation of a state record at a non-network site is unusual with extra scrutiny required, but other sites in the area reported 20-40% of their yearly rainfall in just 8-12 hrs. Acurite rain gauge at sewer...
Read 9 tweets
Aug 15, 2019
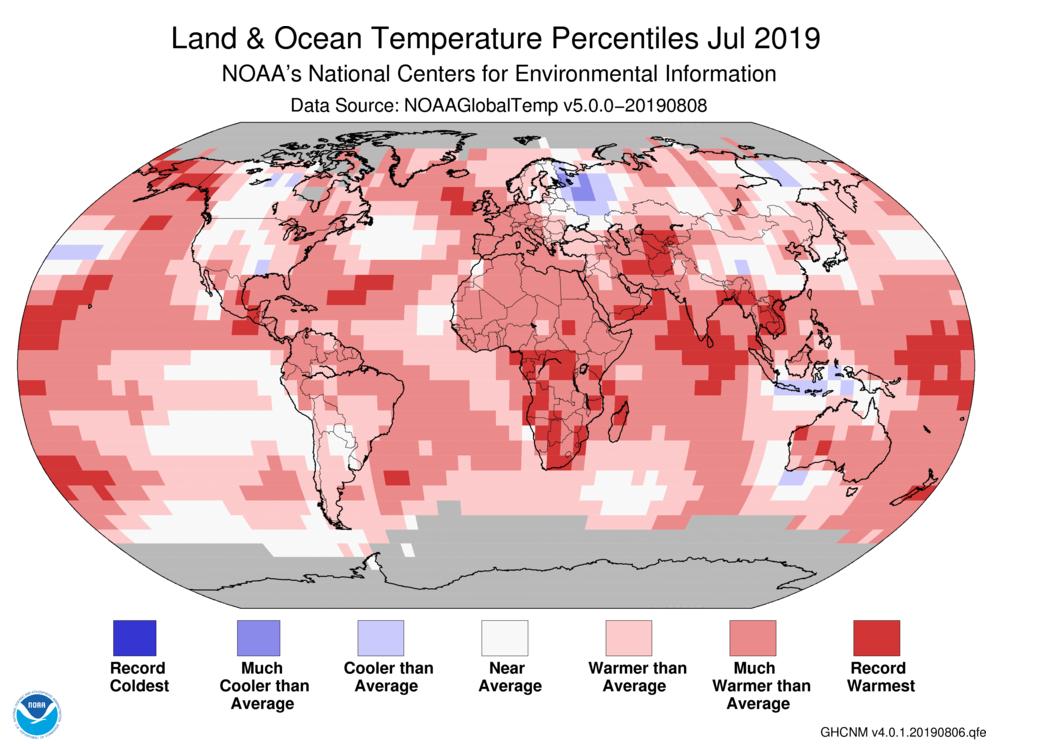
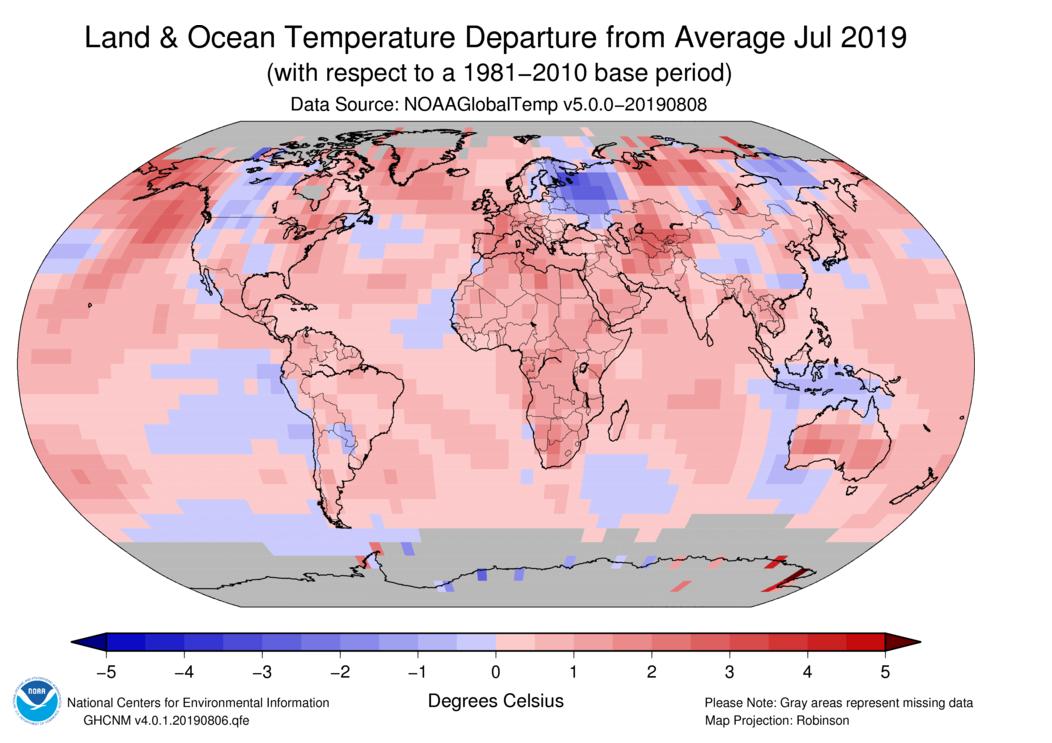
We have just released the July 2019 Global Climate Report. Follow this thread for details. Also, read more online: bit.ly/Global201907 #StateOfClimate
At 1.71°F above average, the July 2019 global temperature ranked as the warmest July and the warmest month on record: bit.ly/Global201907 #StateOfClimate
See July 2019 temperature departures from average around the globe: bit.ly/Global201907 #StateOfClimate
Read 16 tweets

Did Thread Reader help you today?

Support us! We are indie developers!


This site is made by just two indie developers on a laptop doing marketing, support and development! Read more about the story.

Become a Premium Member ($3/month or $30/year) and get exclusive features!

Become Premium

Don't want to be a Premium member but still want to support us?

Make a small donation by buying us coffee ($5) or help with server cost ($10)

Donate via Paypal

Or Donate anonymously using crypto!

Ethereum

0xfe58350B80634f60Fa6Dc149a72b4DFbc17D341E copy

Bitcoin

3ATGMxNzCUFzxpMCHL5sWSt4DVtS8UqXpi copy

Thank you for your support!

Follow Us!

:(