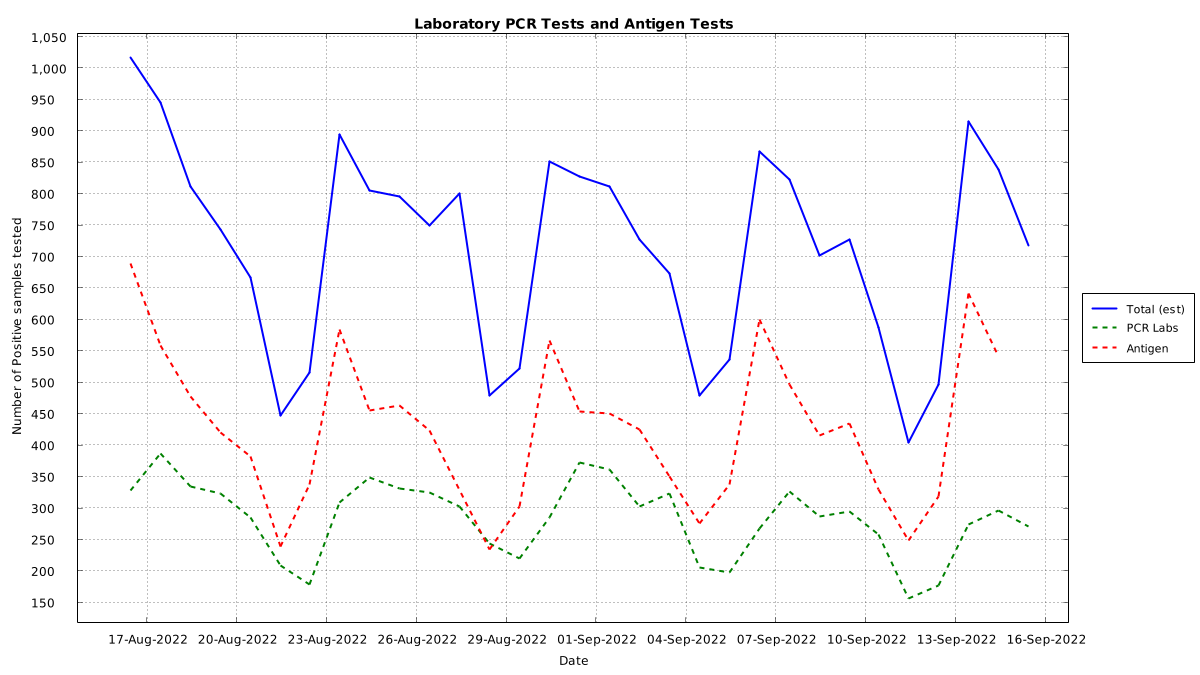
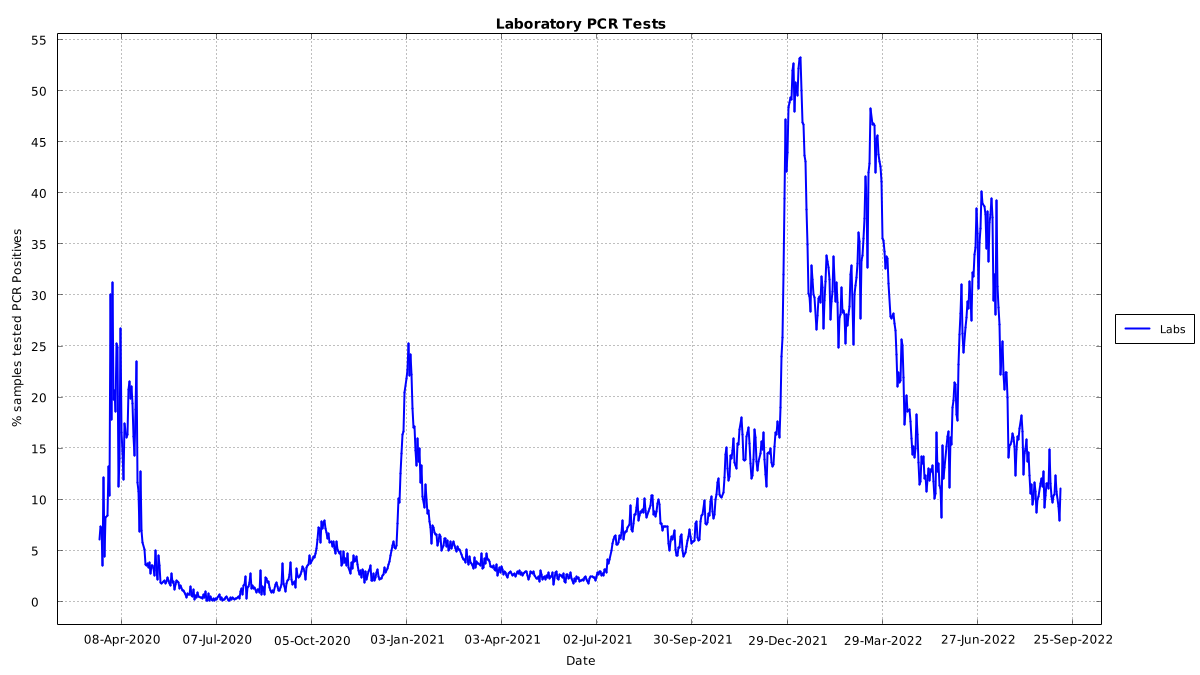
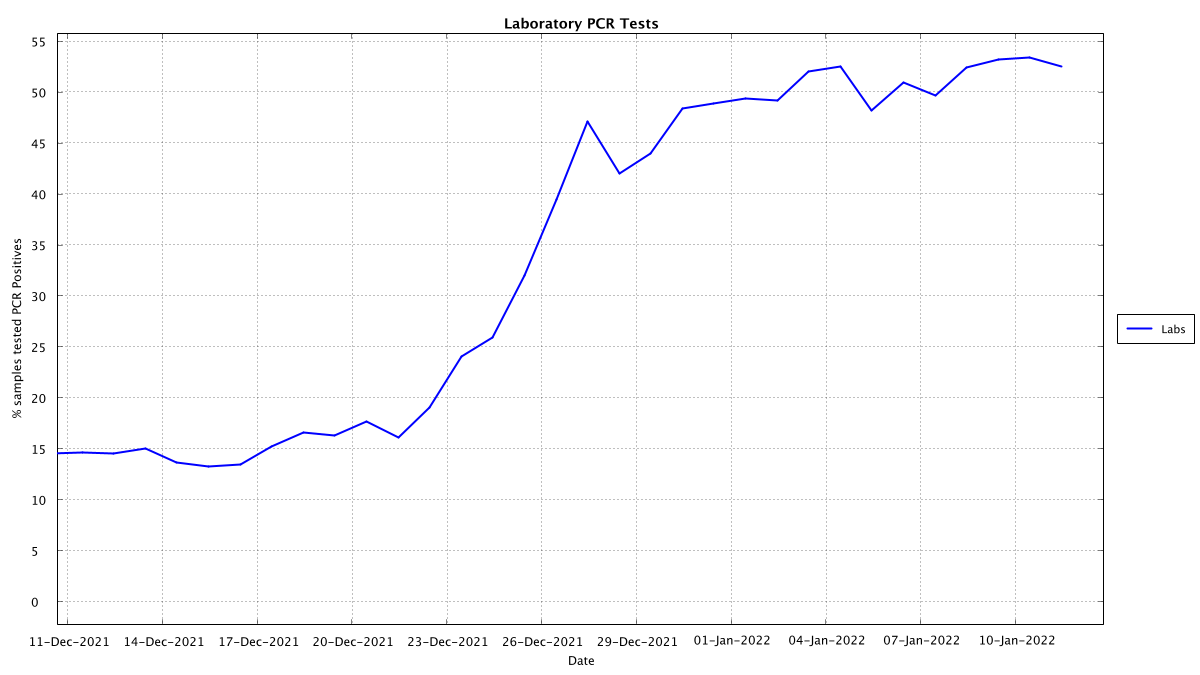
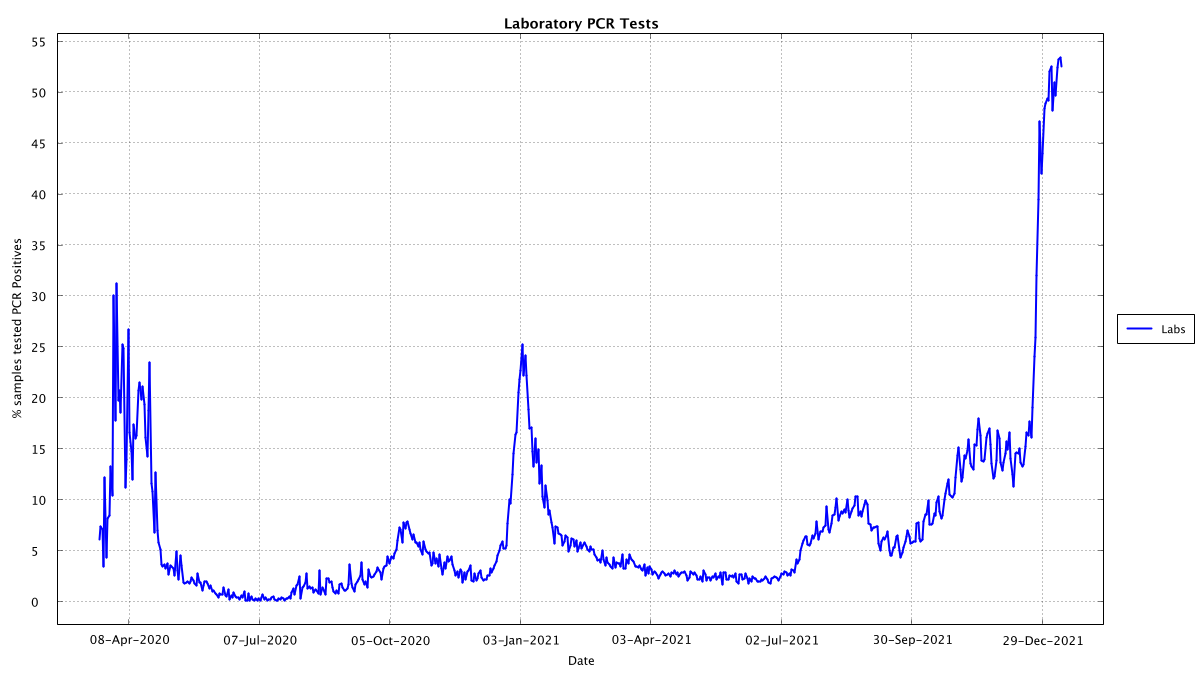
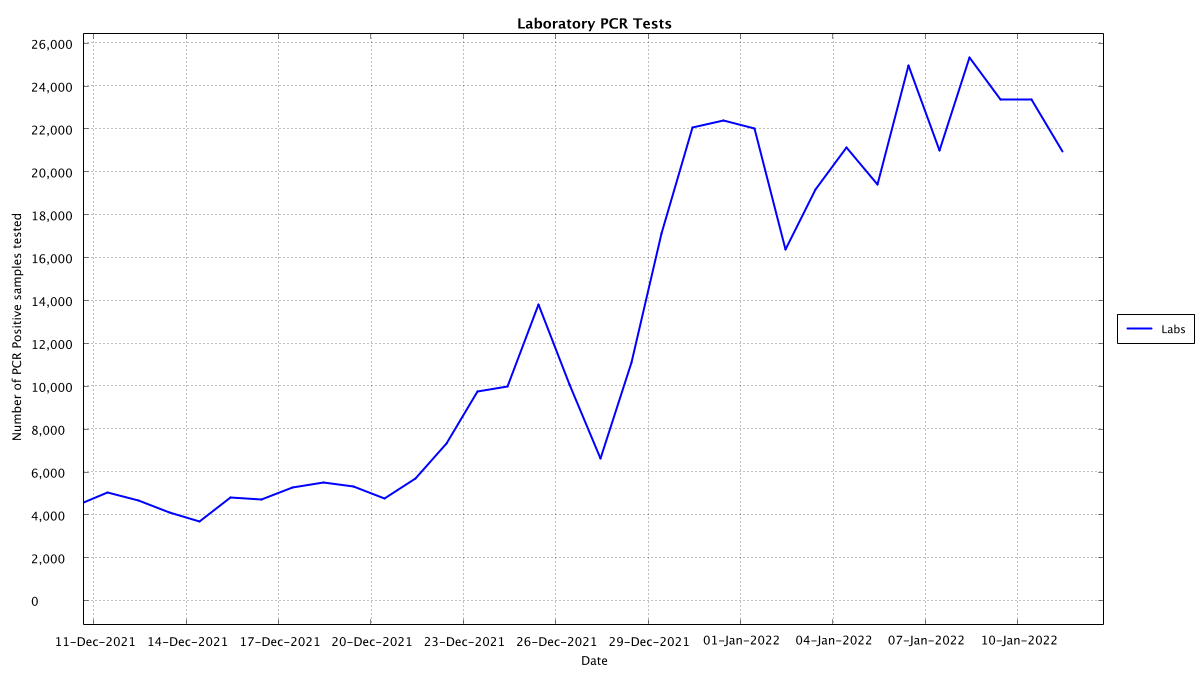
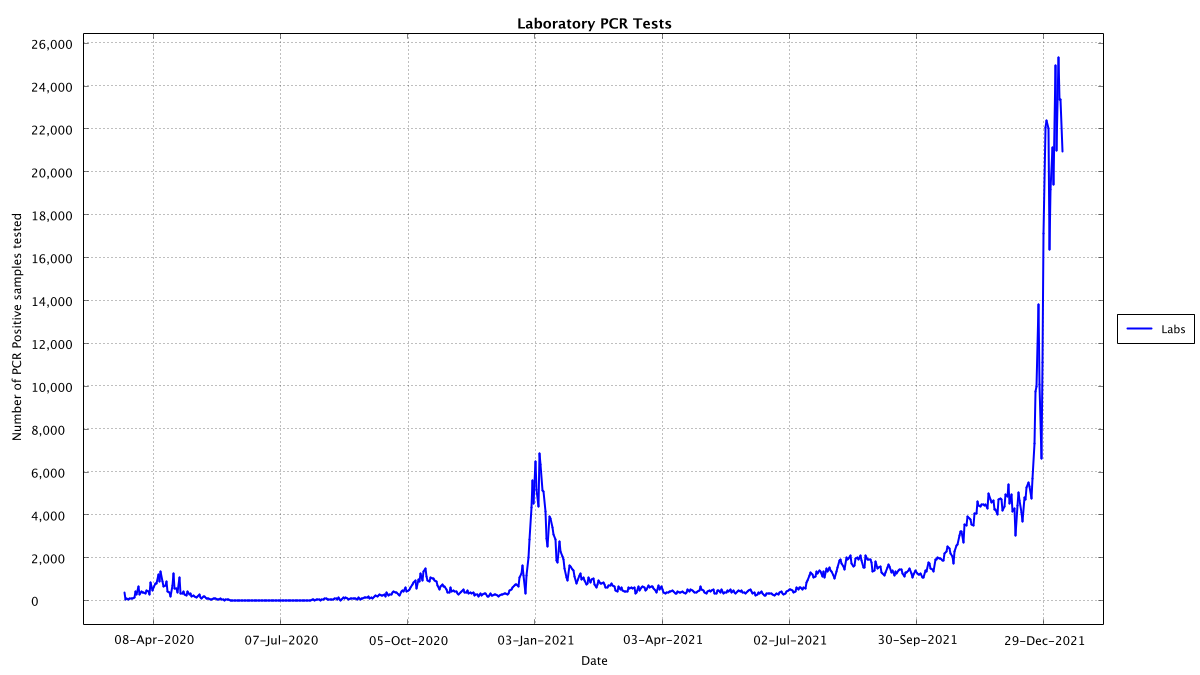
Ireland 🇮🇪 PCR lab tests 2022-01-11
• Positives ↓2422 to 20960
• Tests ↓3876 to 39871
• Positivity ↓0.9 to 52.6%
• Positives ↓2422 to 20960
• Tests ↓3876 to 39871
• Positivity ↓0.9 to 52.6%
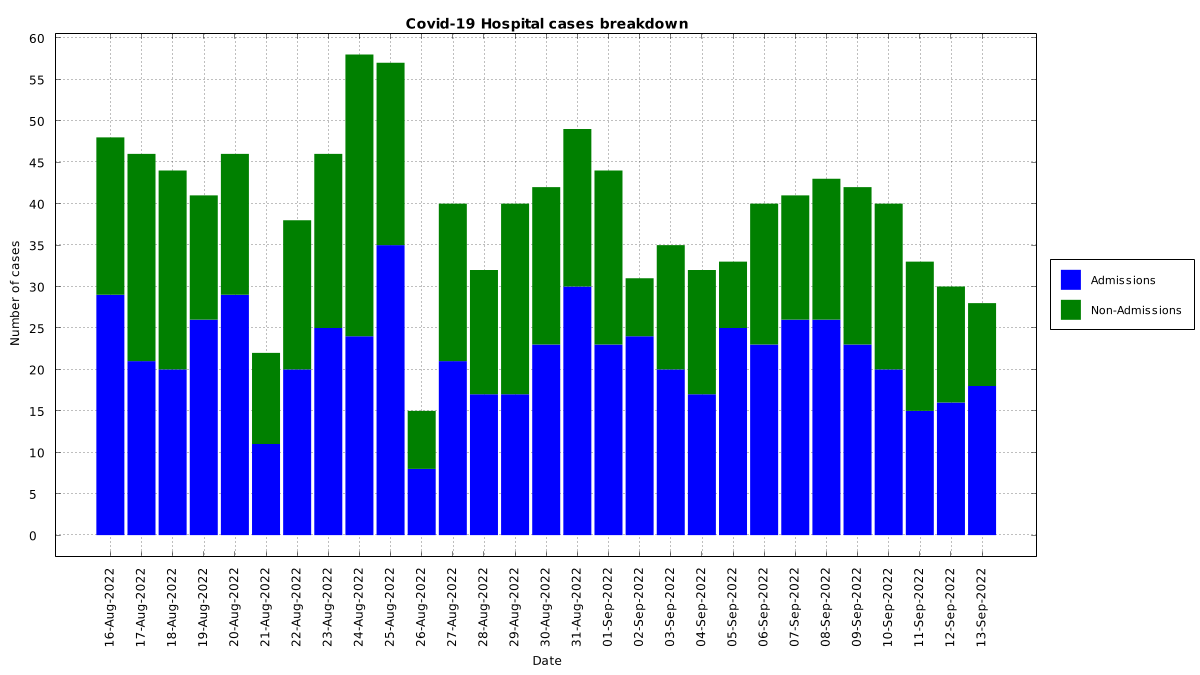
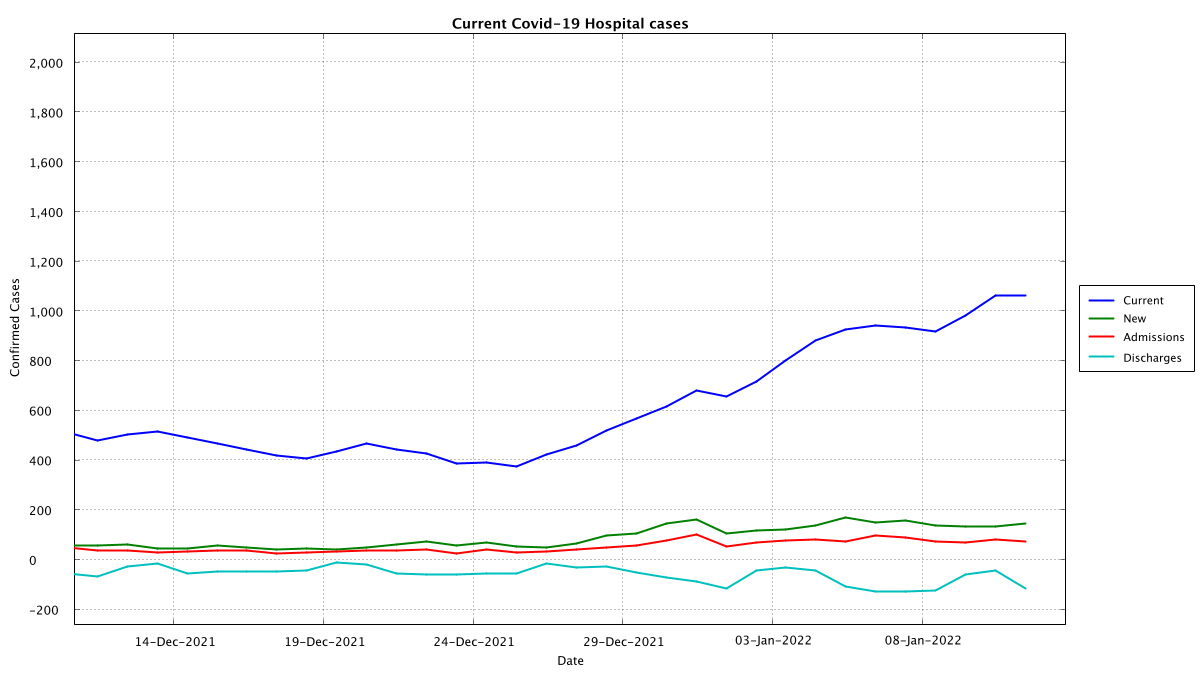
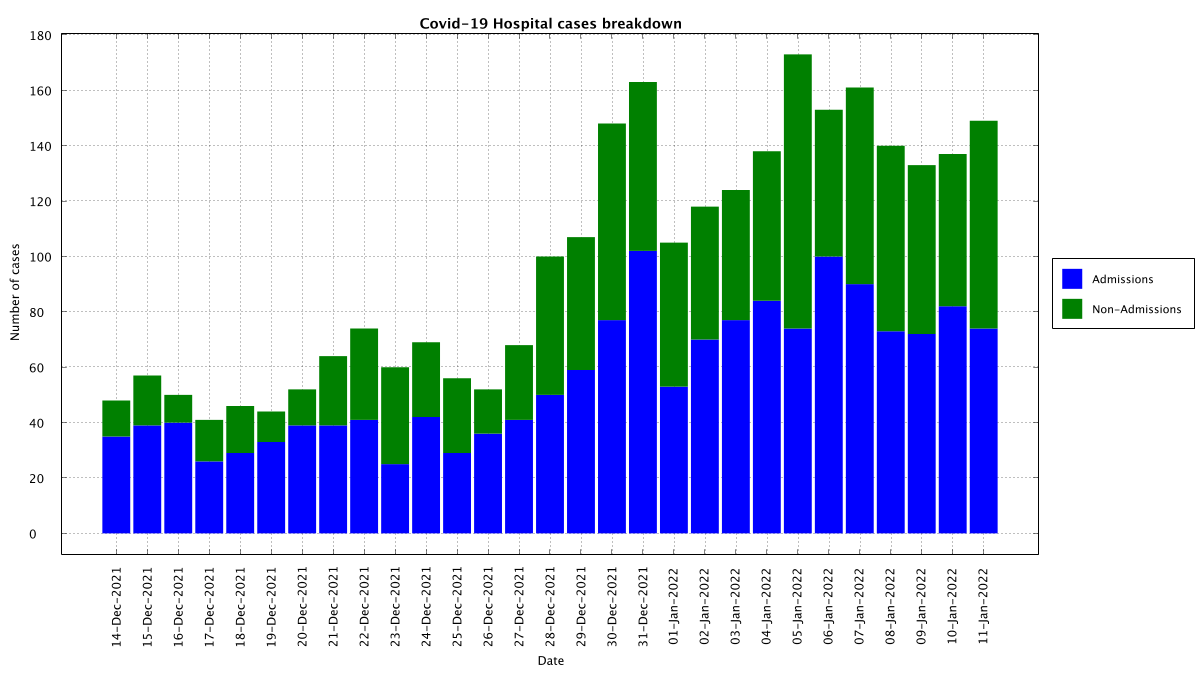
Ireland 🇮🇪 Covid Hospital general 2022-01-11
• Occupancy with +ve ↓1 to 1062
• Admission with +ve ↓8 to 74
• Post admission +ve ↑20 to 75
• Occupancy with +ve ↓1 to 1062
• Admission with +ve ↓8 to 74
• Post admission +ve ↑20 to 75
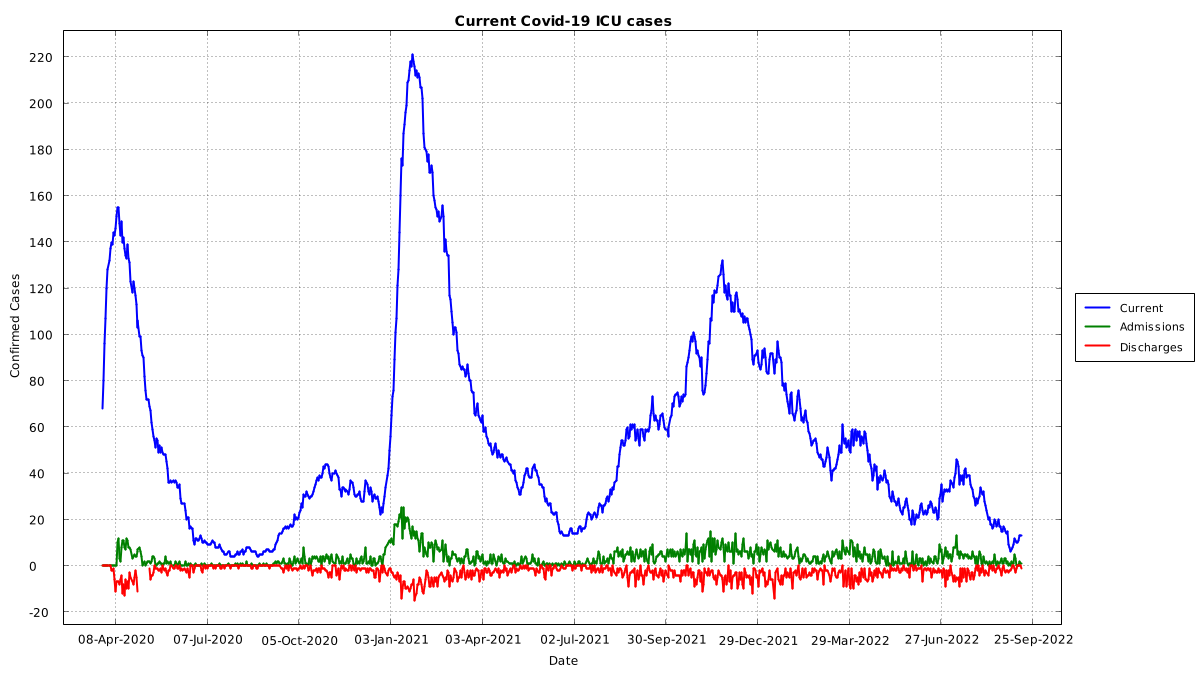
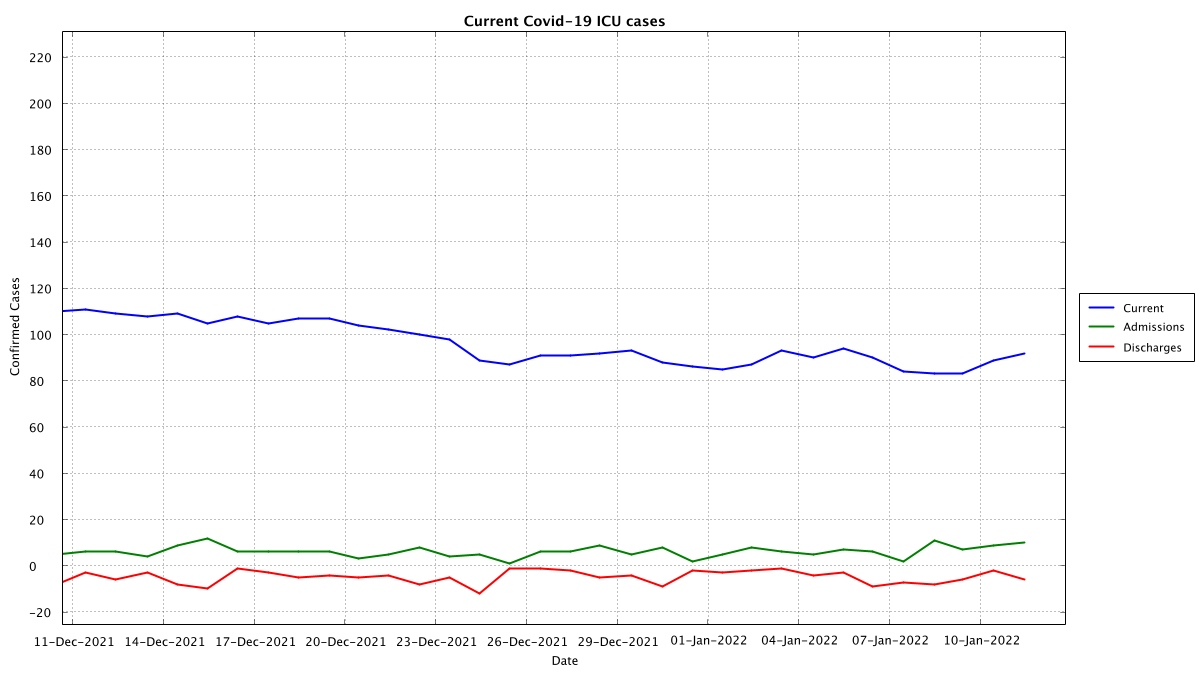
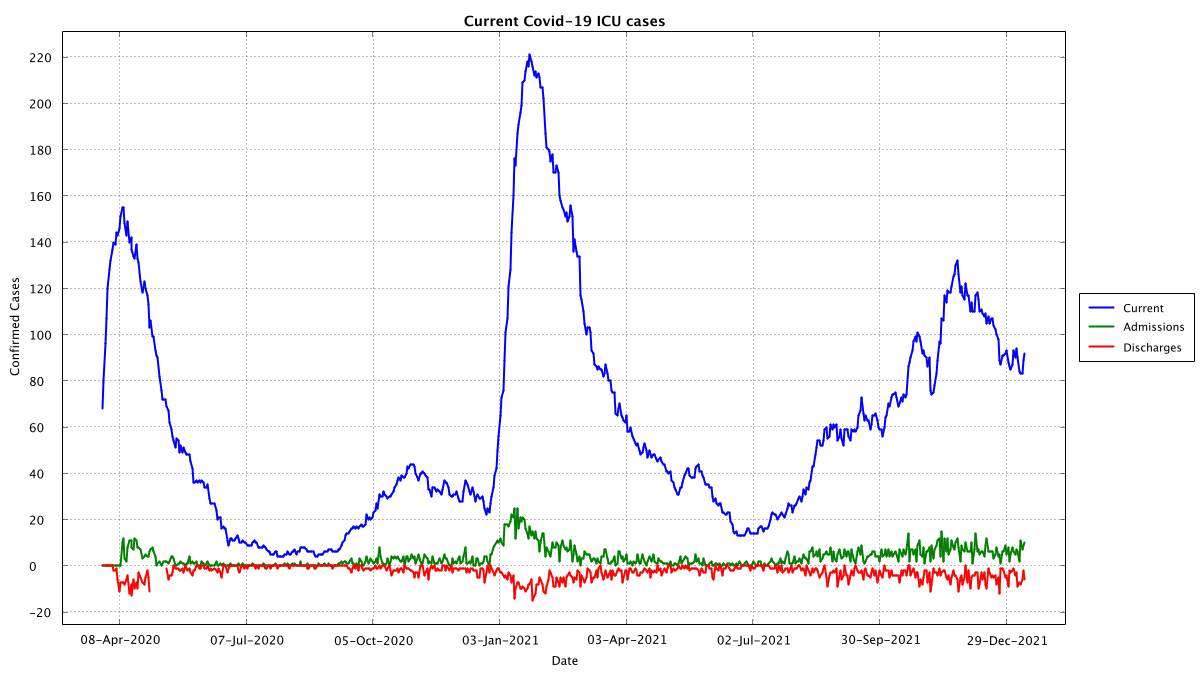
Ireland 🇮🇪 Covid Hospital ICU 2022-01-11
• Occupancy with +ve ↑3 to 92
• Admissions with +ve ↑1 to 10
• Occupancy with +ve ↑3 to 92
• Admissions with +ve ↑1 to 10
Ireland 🇮🇪 Analysis 2022-01-11
🙂 ICU occupancy with Covid is holding steady
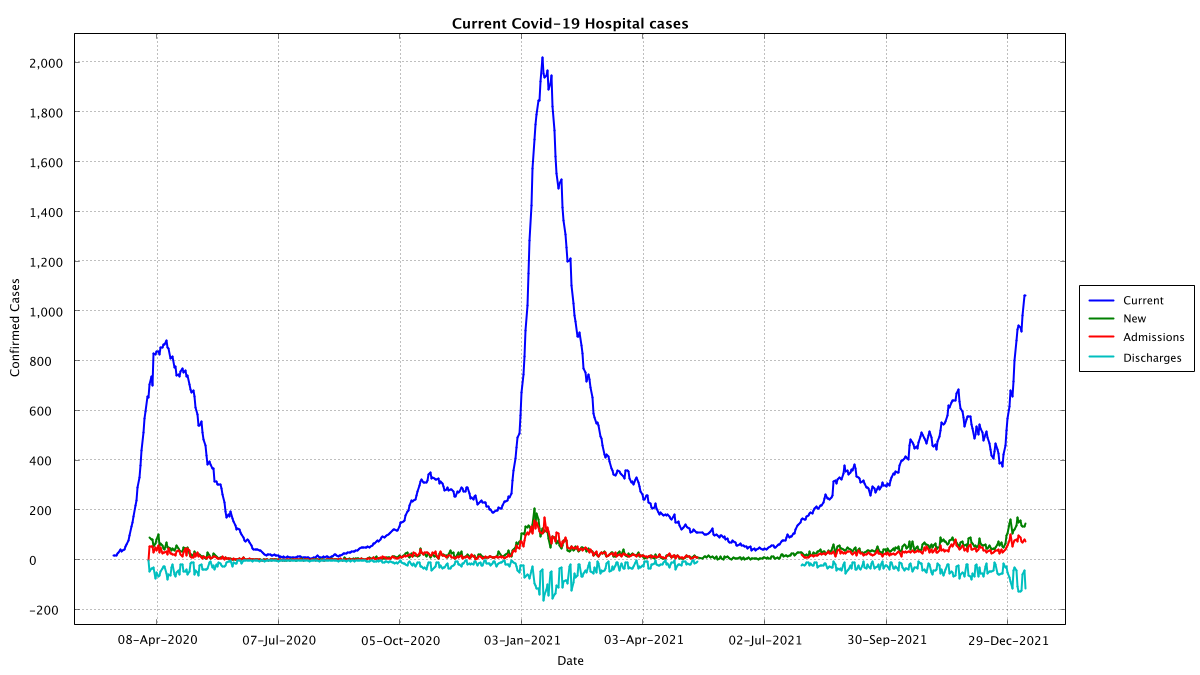
😕 PCR Positivity is holding steady longer vs last year
😟 ICU admissions with Covid are slightly concerning, one swallow does not a summer make but 9-10 per day is similar to early Nov '21 with Delta.
🙂 ICU occupancy with Covid is holding steady
😕 PCR Positivity is holding steady longer vs last year
😟 ICU admissions with Covid are slightly concerning, one swallow does not a summer make but 9-10 per day is similar to early Nov '21 with Delta.
Ireland 🇮🇪 All data time-shift graph 2022-01-11
Note: as the level of smoothing is increased we see the time shift alignment of the peaks
Note: When smoothing is low (< 6 days) we can see current cause for concern in ICU admissions (red), but by sigma=12 days it's flat
Note: as the level of smoothing is increased we see the time shift alignment of the peaks
Note: When smoothing is low (< 6 days) we can see current cause for concern in ICU admissions (red), but by sigma=12 days it's flat
All data sourced from covid-19.geohive.ie/search
I am maintaining an archive of the geohive data tracked every hour on github.com/stephenc/2021-…
My full set of graphs is available from github.com/stephenc/2021-… (updated daily at 16:15 UTC and manually if I see the data updated early)
I am maintaining an archive of the geohive data tracked every hour on github.com/stephenc/2021-…
My full set of graphs is available from github.com/stephenc/2021-… (updated daily at 16:15 UTC and manually if I see the data updated early)
If you have suggestions for improvements, constructive criticism or additional graphs please reply to this tweet or DM me.
NOTE: While my personal biases are not a secret but I try to keep them out of my analysis of the Irish data and the graphs from the Irish data. If you choose to follow me on twitter be aware that some of my other tweets may expose my biases either directly or by asking questions!
• • •
Missing some Tweet in this thread? You can try to
force a refresh