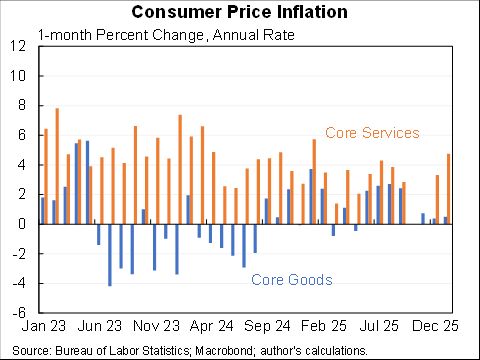
Headline CPI was 0.5% for December, core was 0.6%. Cars were a big part of the number (again) but inflation continues to broaden--the "other" excluding cars and pandemic services is high for the third month in a row. 

Inflation is still almost entirely driven by durable goods not services. Durable goods inflation should come down as supply chains unsnarl but what will happen to services is the big question--is drifting up a little bit lately.

One reason to expect services to rise more is that they include shelter--which includes rent and owner's equivalent rent. The CPI is showing a much smaller increase than other measures. They're not comparable but measures of new leases show the future for all leases.

The US-Euro area gap widened a bit in December as well. Looking over twenty-four months on a comparable basis US is 2pp higher. Slightly less comparable but comparing core Euro area to core US ex shelter shows an even larger gap.


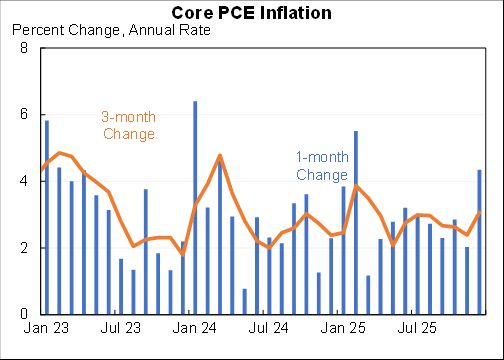
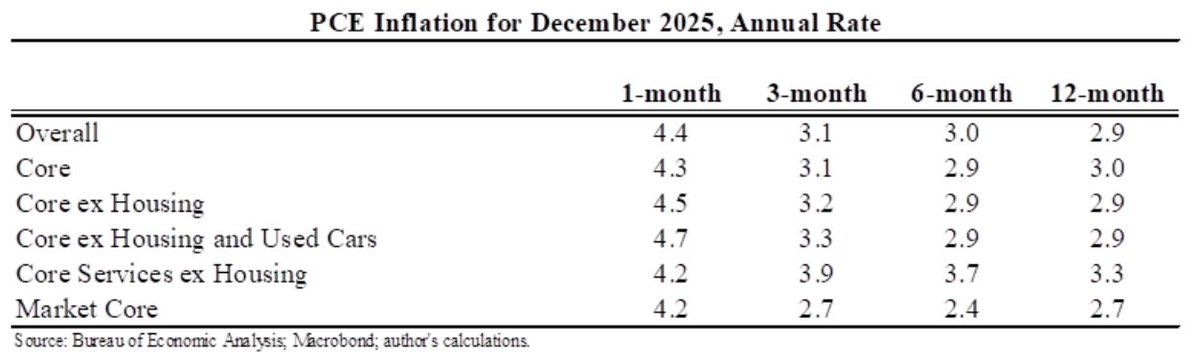
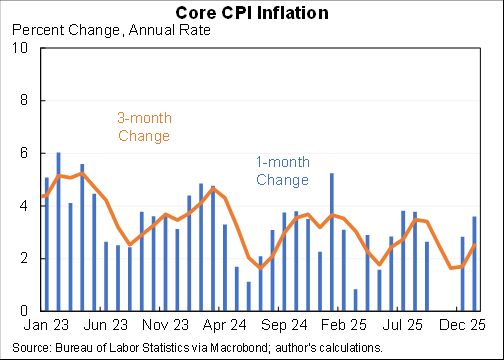
Finally this looks at core CPI over different time periods. 24 months avoids base effects (which are relatively small now), 12 months is the headline number, and 3 months is what is happening lately.

In terms of where we're going, this report doesn't do much to clarify--the same exact debates from the last several months are still applicable (including is it temporary supply chain and durables or will it shift to services.
My views on what people got wrong last year and what could happen this year in this (long) thread.
Slowing inflation this year is the most likely scenario, most experts expect it to slow to around 2% in the second half, I would take the over on that.
Slowing inflation this year is the most likely scenario, most experts expect it to slow to around 2% in the second half, I would take the over on that.
https://twitter.com/jasonfurman/status/1480212229798699011?s=20
• • •
Missing some Tweet in this thread? You can try to
force a refresh