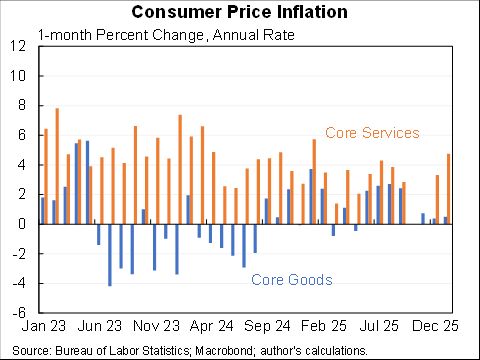
A closer look at inflation in services excluding energy, this accounts for about 60% of the CPI and 75% of the core CPI.
Over the last three months up at a 4.6% annual rate compared to 2.9% annual rate pre-pandemic.
That excess is adding ~1.2pp to annualized core CPI.
Overall core services are still below trend--but is moving up more quickly so converging towards/above trend. You could look at that and say that our only inflation problem is goods. Or you could look at that and say we have another shoe yet to drop.
Leading candidate for yet-to-drop shoe #1 is housing prices. These are still up relatively slowly for *all* housing as compared to the large increases we're seeing for new leases. All should catch up to new.
Potential yet-to-drop shoe #2: pandemic-related prices. We're still in a pandemic. It has been constraining services demand and service prices. If we return to more normal then expect higher prices for airfare, hotels, events, etc.
Potential yet-to-drop shoe #3: there is some evidence from @jimstockmetrics and Mark Watson that service prices are more sensitive to labor market slack than overall prices. And labor markets much tighter now than they were a year ago. nber.org/papers/w25987
But who knows. I expect an undoing of the abnormal rotation to reduce inflation the question is how much--is it enough to get us to 2%? Does it leave us at 3%? And if it leaves us at 3% is the Fed OK with that (as I think they should be) or do they feel they need to fight it?
BTW, here is the same multiple period picture for durable goods that I showed you for core services.
And repeating the durable goods vs. services comparison over the last 24 months that started this discussion in the first place.
• • •
Missing some Tweet in this thread? You can try to
force a refresh
A big upward revision for GDP, was a 3.8% annual rate (up from 3.0% in the advance estimate). For H1 GDP up at a 1.6% annual rate.
The biggest change was consumption which was 2.5% annual rate (up from 1.4% in the advance). Business fixed investment strong, residential weak.
Here is quarterly consumer spending. It looked like it was really slowing but with this upward revision and the July and August indications it's looking much more healthy.
Business fixed investment has been strong. It is unclear how much of this is pulling forward of capital equipment imports to get ahead of tariffs and how much is sustainable. (Note disaggregating structures have been falling while equipment is rising, reducing a disconnect.)
The problem recently has been in both goods and services. Core goods inflation has typically been about zero but in the run-up to this year had deflation. Now tariff-driven inflation.
And at the same time core services inflation has picked up.
A market slowdown in the pace of job gains, with 22K added in August, bringing the three month average to 29K.
On a percentage basis have not seen job growth this slow outside of recessionary periods in more than sixty years.
The unemployment rate rose from 4.2% to 4.3% (unrounded was a smaller increase).
Wage growth was strong and average hours steady.
All of these are consistent with a marked slowdown in labor supply (due to immigration policy) combined with a continued slight softness in labor demand (as evidenced by the unemployment rate which has been steadily rising at about 0.03 percentage point per month for 2-1/2 years.
But two reasons to be less worried than headline: (1) transitory tariffs & (2) some of this is imputed from rising stock market.
Here are the full set of numbers I'll talk about.
Particularly notable is how much lower market core has been than overall core at every horizon. Note regular core includes imputed items, notably portfolio management fees where the price goes up when the stock market goes up.
Market core is both better predicted by slack and a better predictor of future inflation. It has moved sideways this year. But given that tariffs are (hopefully temporarily) pushing inflation up that suggests that underlying inflation is going down.
The jobs slowdown is here with 73K jobs in July & large downward revisions to May & June bringing the average to 35K/month.
Not quite as bad as you might think because steady-state job growth is much lower in a low net immigration world but unemployment still gradually rising.
A small portion of the weaker jobs numbers in recent months are Federal cuts.
But the bigger issues is the slowdown in private job creation.