
Supertrend-Relative Strength Strategy for Positional and Swing Trading
A thread 🔖
on Supertrend and Relative Strength !
Retweet and share if you find it helpful !
1/n
A thread 🔖
on Supertrend and Relative Strength !
Retweet and share if you find it helpful !
1/n
What is Relative Strength ?
📌Relative strength is a strategy used in momentum investing and in identifying value stocks.
📌It focuses on investing in stocks or other investments that have performed well relative to the market as a whole or to a relevant benchmark.
2/n
📌Relative strength is a strategy used in momentum investing and in identifying value stocks.
📌It focuses on investing in stocks or other investments that have performed well relative to the market as a whole or to a relevant benchmark.
2/n
Conditions of Relative Strenght
Relative Strength has a reference zero line
Line >0 Stock is Outperforming
Line <0 Stock is Underperforming
RS period 65 as we have around 65 trading days in 3 month
RS reference as Nifty50 as benchmark index as
3/n
@kuttrapali26
Relative Strength has a reference zero line
Line >0 Stock is Outperforming
Line <0 Stock is Underperforming
RS period 65 as we have around 65 trading days in 3 month
RS reference as Nifty50 as benchmark index as
3/n
@kuttrapali26

Outperformance Vs Underperformance
4/n
4/n


How to apply in #tradingview
Type
“Relative Strength”
Choose any
By bharattrader
By traderlion
By Modhelius
I use by bharattrader
In setting use 65 period
5/n
Type
“Relative Strength”
Choose any
By bharattrader
By traderlion
By Modhelius
I use by bharattrader
In setting use 65 period
5/n

SuperTrend :
It is TrendFollowing Indicator That generates Buy / Sell signals based on the ATR value or volatility of the stock
Supertrend also works as a trailing stop-loss for the existing trades Best on daily time frame
6/n
It is TrendFollowing Indicator That generates Buy / Sell signals based on the ATR value or volatility of the stock
Supertrend also works as a trailing stop-loss for the existing trades Best on daily time frame
6/n


Supertrend Conditions
Works Best on 10 , 3 settings
One can try and backtest on 10 ,2 at own also !
Doesnt Work well in Sideways Zone as it is trend following indicator
@Techno_Charts
7/n
Works Best on 10 , 3 settings
One can try and backtest on 10 ,2 at own also !
Doesnt Work well in Sideways Zone as it is trend following indicator
@Techno_Charts
7/n

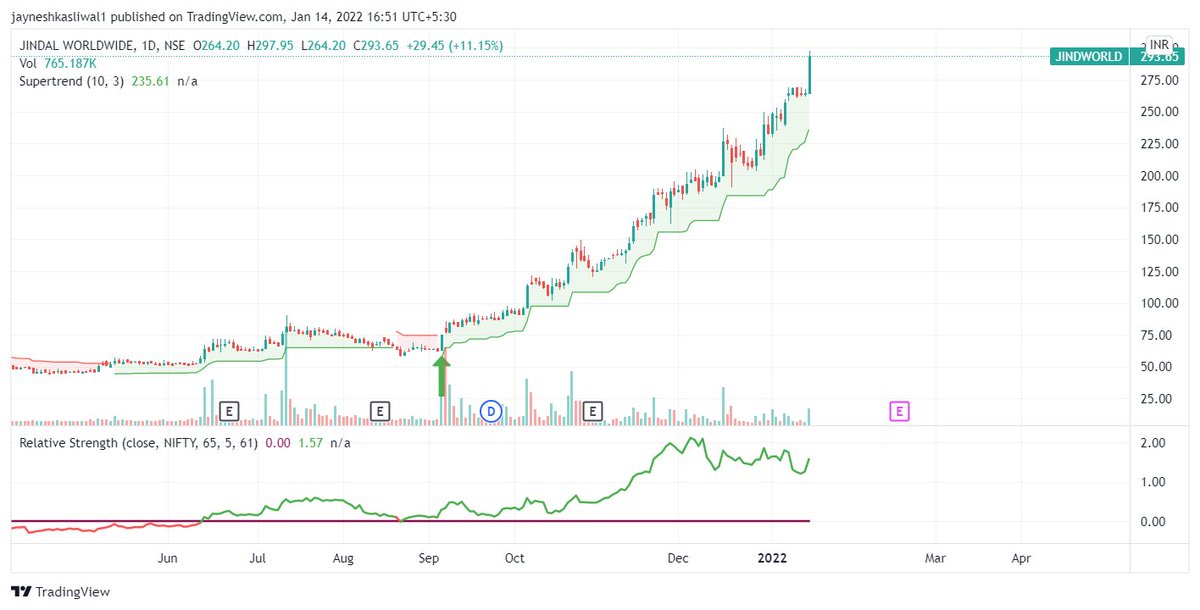
Buy Signal Rules
Stock above 50 ema
SuperTrend turned Positive
Rs line increasing and in positive
Volume up on updays and down on downdays
Daily Time only
Stock has to be in clear Uptrend for buy and Ideally near 52 week High
@MarketScientist
8/n
Stock above 50 ema
SuperTrend turned Positive
Rs line increasing and in positive
Volume up on updays and down on downdays
Daily Time only
Stock has to be in clear Uptrend for buy and Ideally near 52 week High
@MarketScientist
8/n

Target 10 to 15 %or can be trailed using 50/ ema
Stop loss max 7 – 10 % in any case or nearest swing whichever is less
Ideal stop loss 5%
Position size 5-7%
In case you have to enter fresh when both are already positive enter on High Volume Breakouts
Example Shared at 430
9/n
Stop loss max 7 – 10 % in any case or nearest swing whichever is less
Ideal stop loss 5%
Position size 5-7%
In case you have to enter fresh when both are already positive enter on High Volume Breakouts
Example Shared at 430
9/n

Sideways Stock
Supertrend tends to give too many signals in sideways stocks hence its advised to only take trades based on breakout of range in this .
No trend following works in sideways market hence its best to stay sideways or looks for proper oppurtunities
10/n
Supertrend tends to give too many signals in sideways stocks hence its advised to only take trades based on breakout of range in this .
No trend following works in sideways market hence its best to stay sideways or looks for proper oppurtunities
10/n


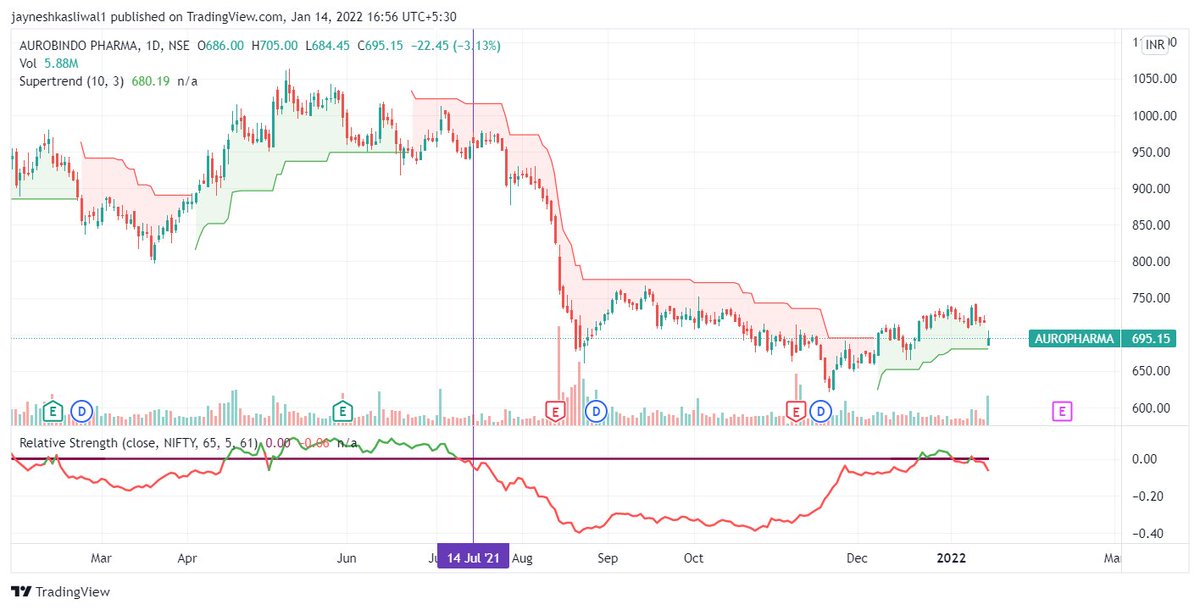
Sell Signal Rules
Stock Below 50 ema
Supertrend Negative
Rs line decreasing and negative
Price near resistance or bearish patterns like double tops etc
Daily Time only
Stock below 20% of 52 week high
volume Increasing on sell side
@premalparekh
11/n
Stock Below 50 ema
Supertrend Negative
Rs line decreasing and negative
Price near resistance or bearish patterns like double tops etc
Daily Time only
Stock below 20% of 52 week high
volume Increasing on sell side
@premalparekh
11/n

Target 10 to 15 %or can be trailed using 50/21 ema
Stop loss max 7 - 10 % in any case or nearest swing whichever is less
Ideal stop loss 5%
Position size 5 - 7 %
A similar Setup was shared by @vivbajaj Sir on 2 hour Tf on youtube can check it out !
One can even Modify This
12/
Stop loss max 7 - 10 % in any case or nearest swing whichever is less
Ideal stop loss 5%
Position size 5 - 7 %
A similar Setup was shared by @vivbajaj Sir on 2 hour Tf on youtube can check it out !
One can even Modify This
12/
To learn More about Relative Strength
Swing Trading Mentorship Starting this Sunday 16 Jan
Intrested people Dm Link for Enquiry
wa.link/si4jn4
13/n
https://twitter.com/JayneshKasliwal/status/1480449068891455488?s=20
Swing Trading Mentorship Starting this Sunday 16 Jan
Intrested people Dm Link for Enquiry
wa.link/si4jn4
13/n
• • •
Missing some Tweet in this thread? You can try to
force a refresh


