Jason Furman Profile picture
Jan 14, 2022 9 tweets 3 min read Read on X
Wow, people reacted very differently to the rise in COVID in December than they did to previous waves.

Retail sales in December:

Nonstore retailers (mostly online): -8.7%
Food services and drinking places: -0.8%

Overall retail sales fell sharply, 1.9% overall.
The decline in retail sales might actually be a positive sign of a healthy normalization.

The economy has struggled to produce enough goods to match the voracious consumer appetite for them. If goods spending continues to normalize that would be, well, good.
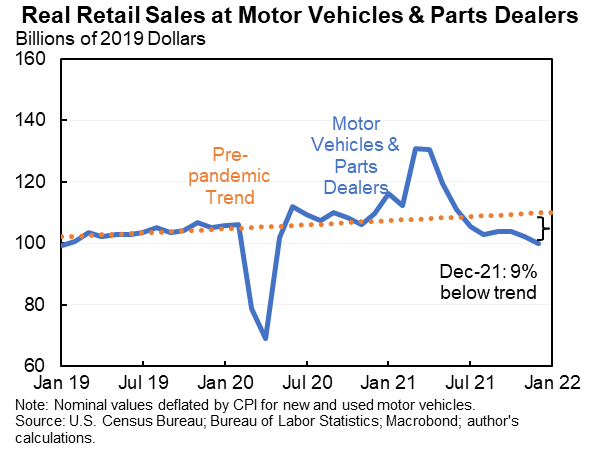
To be clear, the chart in the previous tweet was real retail sales. Nominal retail spending remains very high but in it is no longer buying massive amounts more stuff than it used to be.

(Retail sales is mostly goods but does include services like restaurants and bars.)
The biggest piece of retail sales is spending at motor vehicle and parts dealers (~20 percent of the total). It is up a lot in nominal terms but down in real terms.
Sales at stores selling sporting goods, hobby, musical instruments and books are not nearly as important to the economy (~2% of the total) but they're much more fun and they're WAY up.
People are basically spending a roughly normal amount at restaurants, give or take. But with prices up they're getting less for it in real terms. With this service part of retail sales lagging it suggests the goods part is a bit more above trend than I've shown.
The December numbers plus downward revisions for November have led the bean counters to lower their forecasts for Q4 GDP growth to more like 6% instead of 7%. But that's still very strong. And if that growth is also happening in a more balanced, sustainable way that's good.
P.S. Omicron was just starting to wreak its havoc in December and people were slowly adjusting. I expect a lot more disruption to the January data. But also think that most analysts should mostly look through the January data which will (hopefully, fingers crossed) be anomalous.
P.P.S. Takeout counts as a purchase from "food service & drinking places." So these data don't tell us what happened to face-to-face behavior. But people weren't making a major shift from restaurant-prepared meals to home-prepared meals (w/ grocery store sales down in December).

• • •

Missing some Tweet in this thread? You can try to force a refresh
 

Keep Current with Jason Furman

Jason Furman Profile picture

Stay in touch and get notified when new unrolls are available from this author!

Read all threads

This Thread may be Removed Anytime!

PDF

Twitter may remove this content at anytime! Save it as PDF for later use!

Try unrolling a thread yourself!

how to unroll video
  1. Follow @ThreadReaderApp to mention us!

  2. From a Twitter thread mention us with a keyword "unroll"
@threadreaderapp unroll

Practice here first or read more on our help page!

More from @jasonfurman

May 16
Average hourly earnings growth has been drifting down recently. Was strong for much of 2023 but negative three months in a row--zero for the last 6 months (I use a 6 month line instead of my usual 3 due to high volatility).

Overall +0.7% since pre-COVID. Image
Same story if you exclude generally higher-paid managers and focus on production and non-supervisory workers--also zero over the last six months but in this case is much stronger over the full period, up 2.8% since pre-COVID. Image
No matter how you look at it average hourly workers for all private sector workers are below trend. They're up at a 0.2% annual rate since pre-COVID, were growing much faster before then.

A lot of that is higher-paid workers not doing as well... Image
Read 7 tweets
May 15
The CPI-based Ecumenical Underlying Inflation measure was 3.5% in April, up from 3.3% in February and 3.4% in March. Although it is normalized to be equivalent to the PCE has been running (unusually) ~50bp higher than PCE.

Is the median of 7 measures over 3, 6 and 12 months. Image
It includes the official BLS measures plus median and trimmed mean.
Image
Image
Note, core, median and trimmed mean have been running about the same, suggesting it is not special factors elevating inflation--except leaving over the possibility of one giant special factor in all three, shelter, which has lags. Image
Read 4 tweets
May 15
Forecasters got this month exactly right. Monthly core CPI inflation rate eased off a little from the last few months but still high.

Annual rates:

1 month: 3.6%
3 months: 4.1%
6 months: 4.0%
12 months: 3.6% Image
I won't make you wait for the full set of numbers. All of them slowed a bit from previous months. Image
A certain amount has been made about how it's *all* shelter. That is true over 12 months, core CPI ex shelter up 2.1%. But over the last six months is a 2.9% annual rate so that more reassuring number has a lot of lagged data in it. Image
Read 8 tweets
May 3
Pretty much a goldilocks job report. 175K jobs is respectable at any time and in the context of strong prior months so a ~250K monthly average even more so.

Unemployment ticked up to 3.9%.

Earnings growth slowed.

Most reassuring data for the Fed in the last 2+ weeks. Image
The unemployment rate has been below 4.0% for more than two years now. A very slight upward drift. Image
At the same time the prime age employment rate is rising again and remains above pre-COVID. This had not been the pattern for the last few recessions. Image
Read 7 tweets
May 2
Productivity growth came in at a 0.3% annual rate in Q1. It is very volatile so here are annualized growth rates in rough order of meaningfullness:

Since 2019-Q4: 1.5%
Last two years: 1.2%
Last year: 2.9%
Last quarter: 0.3% Image
Overall productivity is about 1% below CBO's pre-pandemic forecast.

(The fact that output is a little above CBO's pre-pandemic forecast is because labor, particularly through immigration, has come in higher than expected.) Image
Europe is way below trend and falling. Very different from the picture above. Image
Read 5 tweets
May 1
Job openings and quits both fell in March as a wide range of labor market indicators are consistent with a cooling economy--and a labor market that, broadly, is like where it was in 2019--with lower quits but higher openings (with a question of whether openings were trending up). Image
The number of job openings per unemployed worker fell from 1.4 last month to 1.3 this month--both well below its peak of 2.0 in March 2022. This is still above pre-COVID but, again, it might have been on an upward trend. Image
These are a variety of indicators of labor market tightness, all normalized to the same standard deviation and a mean of zero pre-COVID. They're all roughly around pre-COVID. Image
Read 7 tweets

Did Thread Reader help you today?

Support us! We are indie developers!


This site is made by just two indie developers on a laptop doing marketing, support and development! Read more about the story.

Become a Premium Member ($3/month or $30/year) and get exclusive features!

Become Premium

Don't want to be a Premium member but still want to support us?

Make a small donation by buying us coffee ($5) or help with server cost ($10)

Donate via Paypal

Or Donate anonymously using crypto!

Ethereum

0xfe58350B80634f60Fa6Dc149a72b4DFbc17D341E copy

Bitcoin

3ATGMxNzCUFzxpMCHL5sWSt4DVtS8UqXpi copy

Thank you for your support!

Follow Us!

:(