1/5 A thread to go over my interpretation of interest rates.
First this is what the market currently has priced in. 36% for the 5th hike in Feb 2023 is the highest ever.
First hike in March is now 86%. At this point any talk of no hike in March would move the market.
2/5
Earlier this morning Mike Wilson of Morgan Stanley was on Bloomberg TV. He is looking for 1.60% on 2-year yields at mid-year (from 0.945%).
3/5
This fits our view that the 10-year minus 2-year curve can invert by mid-year.
4/5
Why are 10yr ylds trending sideways as 2yr ylds relentlessly rise?
10yr ylds are a risk-off instrument, not an inflation pay. The fact that 10yr ylds are not rising in the face of inflation is a market signal that the Fed is going to hike too much and break something.
5/5
We will know when the Fed has “broken something” when/if the yield curve inverts.
It might not be obvious what broke the day the yield curve inverts, but the market will be signaling that something is indeed broken and it will be apparent in short order.
Bonus
Why will the Fed hike so much they will break something?
Inflation got away from them and is now intensely political. The economists can leave the FOMC board room. Hiking to address inflation is now the domain of politics and PR people worried about Fed optics.
• • •
Missing some Tweet in this thread? You can try to
force a refresh
I have not posted a spot $BTC ETF update in a while, so here is one.
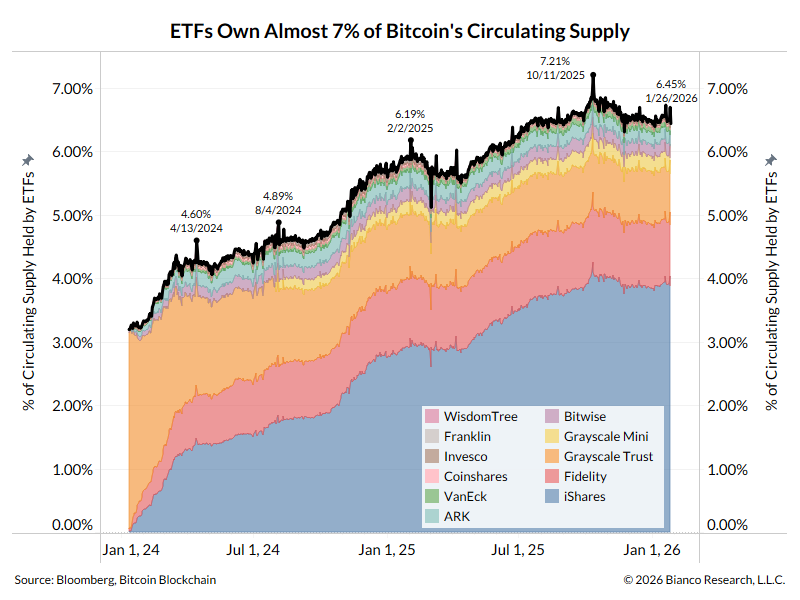
These ETFs started trading a year ago (Jan 11, 2024). Their total assets are $114 billion. (Note that they started at $29B on day 1 due to the $GBTC conversion.)
Three funds make up the vast majority.
2/5
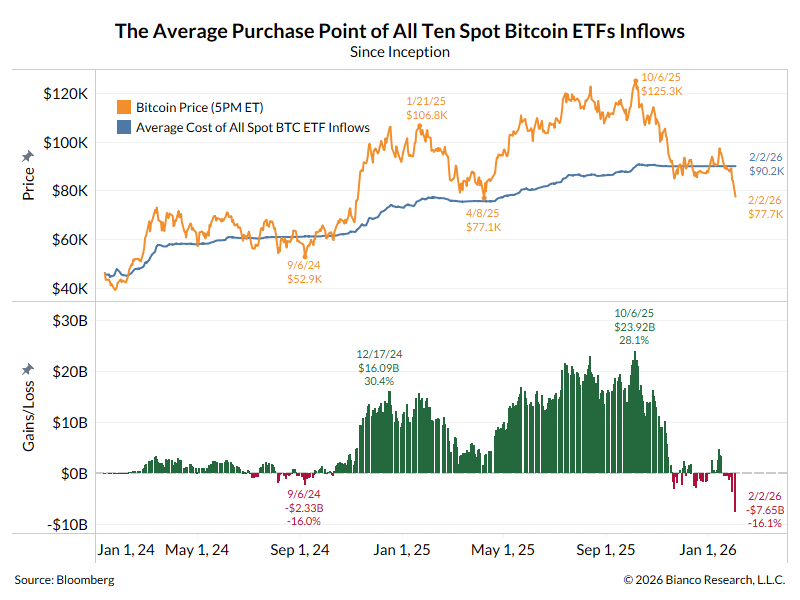
The net NEW money invested in all Spot BTC ETFs was $36.69B (bottom panel).
This excludes the $29B of $GBTC conversion on day 1.
3/5
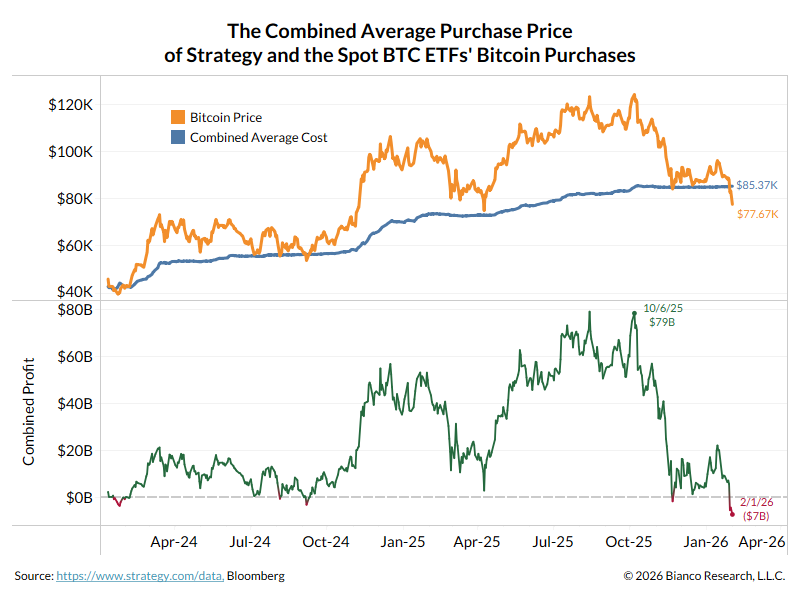
The dollar cost average purchase price is $BTC $74.3k (blue line), representing an unrealized gain of ~25%, or $12.73B (bottom panel).
The repost below expresses a common belief that risk assets are effective inflation hedges.
History suggests they are not.
This chart shows that the inflation of the 1960s and 1970s wiped out 64% of the after-inflation stock gains by 1982 (meaning inflation beat stocks by 64%). And all inflation-adjusted gains of the previous 27+ years (back to 1954) were gone (meaning inflation beat stocks over the previous 27 years).
It took until 1992, 28 years later, for stocks to finally start beating cumulative inflation since 1966.
2/3
Too many vastly underestimate the devastating impact of inflation.
Since the 2021 peak, when the Fed called inflation"transitory," stocks have only beaten inflation by just 15% (with dividends).
So a 10% to 12% correct and a little bit more inflation and four years of relative purchasing power is gone (meaning you are no better off than four years ago).
3/3
As I argue here, the crypto crowd also forgets inflation when they make their long-term forecasts.
🧵on yields and yield curve
---
The 30-year yield made a new 2024 close high yesterday.
Now, the highest yield since November 2023.
2/6
The 10-year yield is just eight basis points away from a new 2024 high.
Two trading days left this year.
3/6
The 2-year funds spread is the narrowest since March 2023 (bottom panel).
The massive reversal to negative in March 2023 was driven by the string of bank failures highlighted by Silicon Valley Bank. These failures were driven by fear of unrealized bond losses. So, while the Fed subsequently hiked three more times through July 2023, this spread inverting signaled the "end is near" for the rate-hiking cycle.
Now, at just -5 bps, this spread is the narrowest it has been in ~20 months and close to signaling "the end is near," if not already done, on the rate-cutting cycle.
TLT is the iShares 20-Treasury ETF, one of today's largest and most influential bond ETFs.
I've been arguing that the bond market rise in yields as the Fed cutting rates has been a rejection of the easing cycle. The bond market is saying the Fed has the wrong policy.
Monetary easing is not necessary given the strength of the US economy (See Atlanta Fed GDPnow) and the coming "Trump Stimulus. Fed easing is raising inflation expectations and driving yields higher.
Here is a chart of TLT's price (black) and cumulative flows (red).
From the day the Fed started hiking (March 16, 2022) to the November 7, 2024, FOMC meeting (labeled), cumulative inflows were steady, totaling over $55 billion.
A reasonable interpretation is that bond investors agreed with the Fed's policy from March 2022 to November 2024, even if it was hiking, as it was fighting inflation.
However, since the Fed cut again in November, bond investors have reversed and fled the bond market. Almost $10 billion has left TLT.
2/3
The bottom panel is a rolling 30-day flow into TLT. The last 30 days have seen a cumulative outflow of $8.69B, easily the largest 30-day outflow in TLT's history.
Again, this outflow started with the November 7 Fed cut, which I interpret as the market screaming "no" at the Fed about its move.
3/3
The chart below shows TLT's volume since 2023. The blue bars label the six highest-volume days in TLT's history. No volume day was over 80 million before 2023.
Thursday, December 19, was the record volume day at 99 million. This was the day after the Fed cut. The previous record was November 6, the day before the Fed cut on November 7.
The market is focused on the Fed meeting, not payroll or CPI days. Investors believe the Fed is making a mistake by cutting rates when it is not needed.