1/ Tinfoil hat time, because we're about to dive into the Verge chart Vs. Bitcoin in 2017. And... something going on with Litecoin.
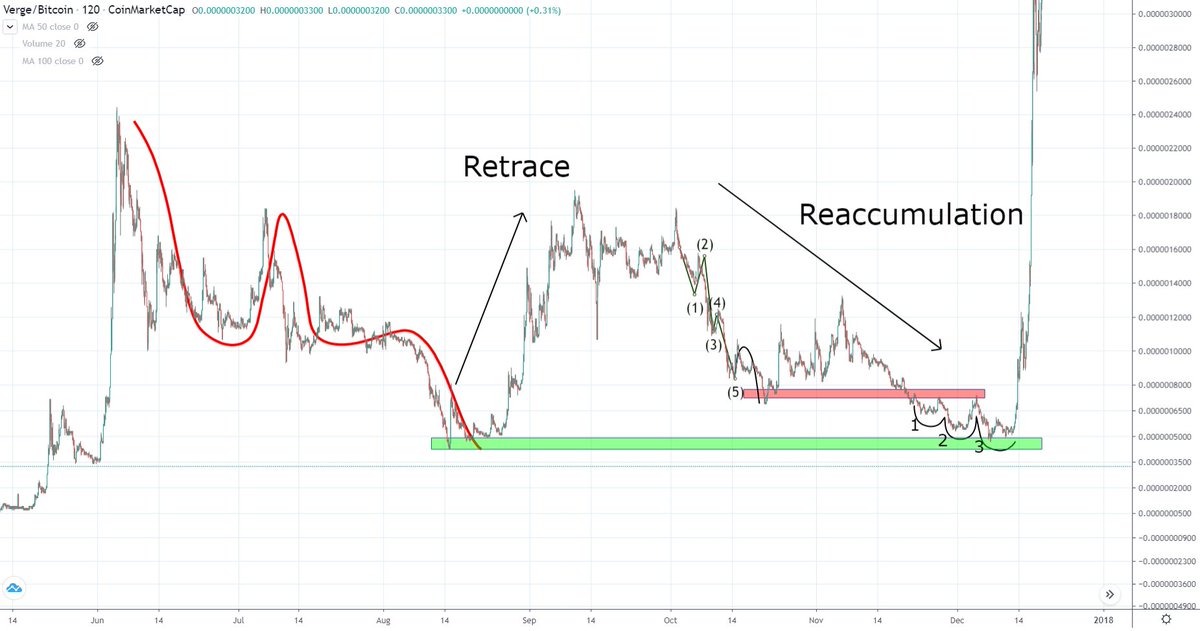
This was the setup the XVG/BTC chart had heading into December of 2017. This chart spans a timeframe of about 7-months, before the mega pump.
2/ And, as strange as it seems, on the scale of nearly 8-years, Litecoin has printed a similar structure vs Bitcoin.
3/ If you spend enough time studying every single in and out of what happened between those two fractals on those two timeframes, it shows you the same general thing is going on between the two.
While some extremes are there, the general format is the same.
4/ Will it play out the same? Time will tell.
And the purpose of this is not to be "FOMO into Litcoin time". As you may know, I'm bullish on the altcoin market in general. And while I own some Litecoin, it doesn't represent the larger part of my portfolio pie.
5/ I spend very little time charting out Alt vs BTC pairs.
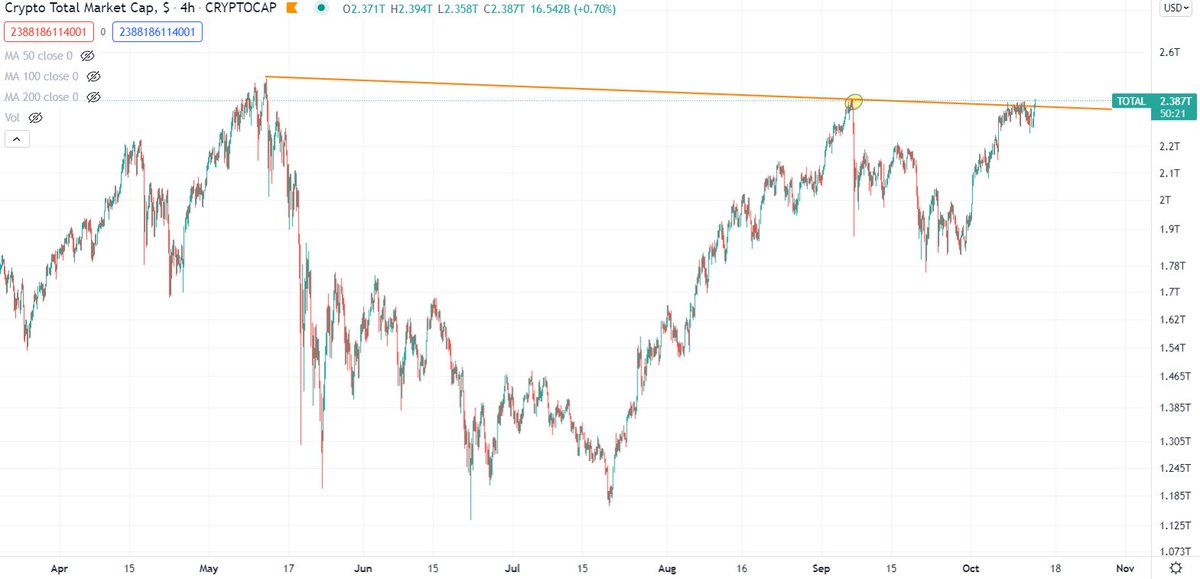
However, with the BTC+ETH Dominance dancing on it's support this long, and all these different pairings near their lows... something feels ready to give. And LTC/BTC might be showing us something.
• • •
Missing some Tweet in this thread? You can try to
force a refresh
I believe the top of Bitcoin is the most likely to occur around $72,000-$75,000, leading into a multi-year bear market.
In this thread, I will present my case as to why I believe this.
I want to preface this by saying I've been a bull on Bitcoin for the entirety of my YouTube channel, established in 2019, with 550+ videos published. I was also bullish on Bitcoin during this most recent pullback of Bitcoin in May, June, and July, expecting new All Time Highs.
So, I'm not a mega bear, who is wrong footed in a short position. This is a data driven thread. Take from it what you will. But, it's my best guess and speculation as to where the top of Bitcoin is.
Thanks for coming out to the livestream. With having technical difficulties, I feel I owe a synopsis of what it was about.
Bitcoin is fighting back above the 0.786 heading into the daily close, still looking for a touch above the B-Wave:
1/4
The Total Market Cap of all of crypto has touched above the September 7th top, on "El Salvador" day. Fighting to breakout the cup and handle:
2/4
The Altcoin Market is in the same boat, and it's looking like an impressive move to the upside is the most likely, after taking out the B-Wave, touching above the .786 retrace since September 7th, and consolidating. Upside breakout seems most likely:
The XRP community is pretty excited right now. So, I'm just throwing this out there to show what's been happening.
Remember, we are still in a range.
1/3
And, the price action over the last day has been a 0.702 retrace of the down move from April 6 - April 12.
Ranges can be brutal. And they can take a long time, revisiting the upper and lower boundaries. As for breakouts on the USD chart, we don't have any just yet.
2/3
We just have to be patient, and for me, the real excitement starts once the last fib levels can crack with conviction, which is around $1.75.
In yesterday's video, I considered those issues as the "real" issues in the SEC's accusation. And it’s just that, an accusation by the SEC. Ripple can defend and prove it all wrong. There are 400+ paragraphs. Out of all of them, I found 3-4 that troubled me. 1% of them.
1/13
However, those issues have been eating away at me. And as a community, it seemed as if it was voodoo to discuss them. Fortunately, someone in the community did a great job finding where Brad mentioned on to @jchatterleyCNN that “institutional investors” received a discount.
2/13
Now, whether that is right or wrong, it's at least out there! It's not some "big secret". That makes me feel better about Ripple, that they aren't hiding that.
But, as a community, we avoided these topics. Lots of "theories" about the instrument and SEC agenda.