Our State of the Climate 2021 is out! carbonbrief.org/state-of-the-c…
⬆ 5th or 6th highest surface temps
⬆ Warmest summer on land
⬆ Warmest year for 25 countries + 1.8 billion people
⬆ Record ocean heat
⬆ Record high GHGs
⬆ Record high sea levels
⬇ Record low glacier mass
1/18
⬆ 5th or 6th highest surface temps
⬆ Warmest summer on land
⬆ Warmest year for 25 countries + 1.8 billion people
⬆ Record ocean heat
⬆ Record high GHGs
⬆ Record high sea levels
⬇ Record low glacier mass
1/18


We saw the 5th warmest (@CopernicusECMWF) or 6th warmest year on record (@NASAGISS @NOAANCEI @BerkeleyEarth). Temperatures were 1.1C to 1.2C above preindustrial levels in 2021:

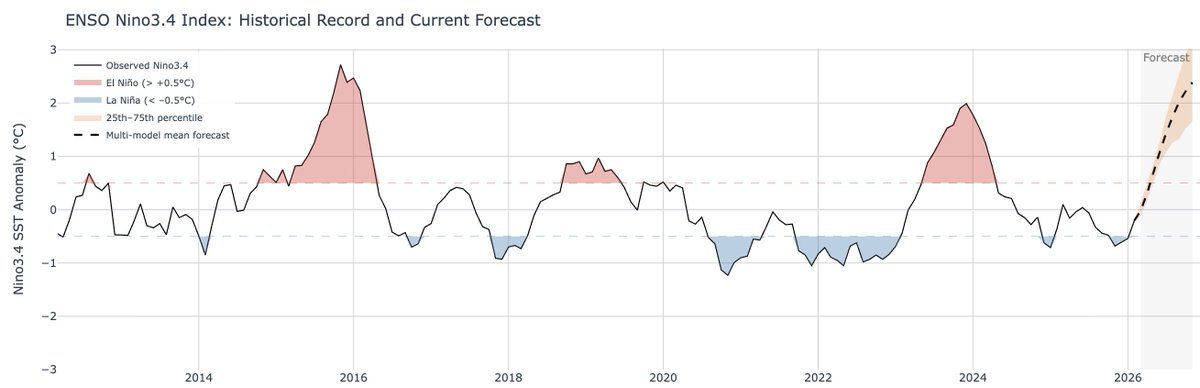
2021 was a bit cooler than the last few years due to a moderate La Nina event. La Nina tends to result in cooler temps globally, though the global response tends to lag 3-4 months after peak conditions. Here is what global temps look like since 1970 with and without ENSO removed:


The years since 2015 – 2021 included – are quite a bit warmer than any years that came before. Barring a Pinatubo-sized eruption in the next few years, its exceedingly unlikely we will ever see a year as cool as 2014 again:

Land temperatures – where we all live – are warming 40% faster than the world as a whole (which is mostly oceans). The world's land has warmed by around 1.8C already since preindustrial times:

Areas home to 1.8 billion people saw their warmest year on record during 2021, with 25 countries – including China, South Korea, Bangladesh and Nigeria – setting all-time annual temperature records. No parts of the world set cold records for the year.

2021 saw the warmest summer (N Hem summer – June, July, August) on record for the world's land areas:

These high temperatures – and the long-term warming trend – contributed to a number of extreme events both in the summer and across the year: carbonbrief.org/guest-post-rev…

Checking in on climate model projections (from the CMIP5 models that provide future projections after 2005), temperatures are pretty well-in-line with what models think they should be:

Note that I'm not featuring a comparison with CMIP6 models; they are less well suited to a multimodel mean approach given a subset of high-sensitivity outliers. The new assessed warming ranges (which downweight too-warm models) in the AR6 only start in 2015 making comparison hard
In the lower troposhere we saw 2021 as the 6th warmest (RSS) or 8th warmest (UAH) year on record. Note that the troposhere tends to see a larger influence of La Nina and El Nino events than the surface.

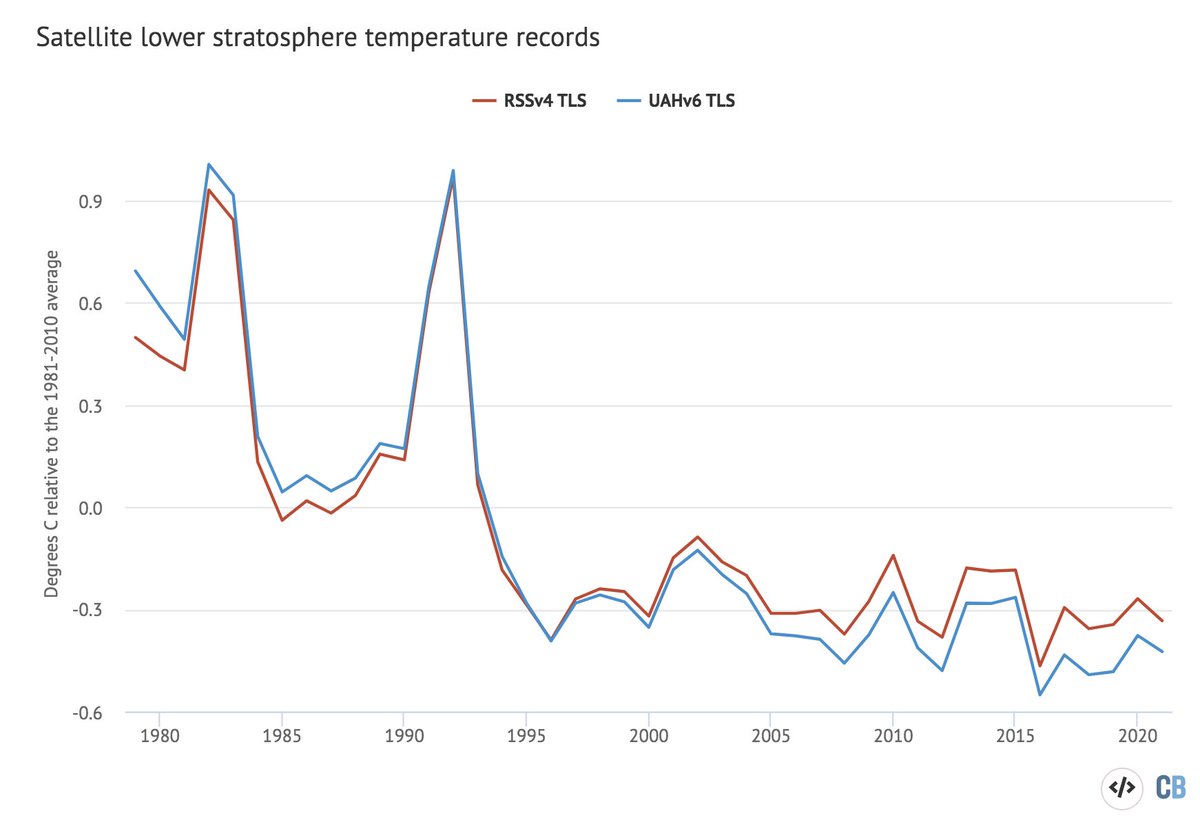
The stratosphere continues to see cooling temperatures. This is a clear fingerprint of climate change from greenhouse gases, which warm the lower part of the atmosphere by trapping heat while cooling the upper atmosphere as less heat escapes.
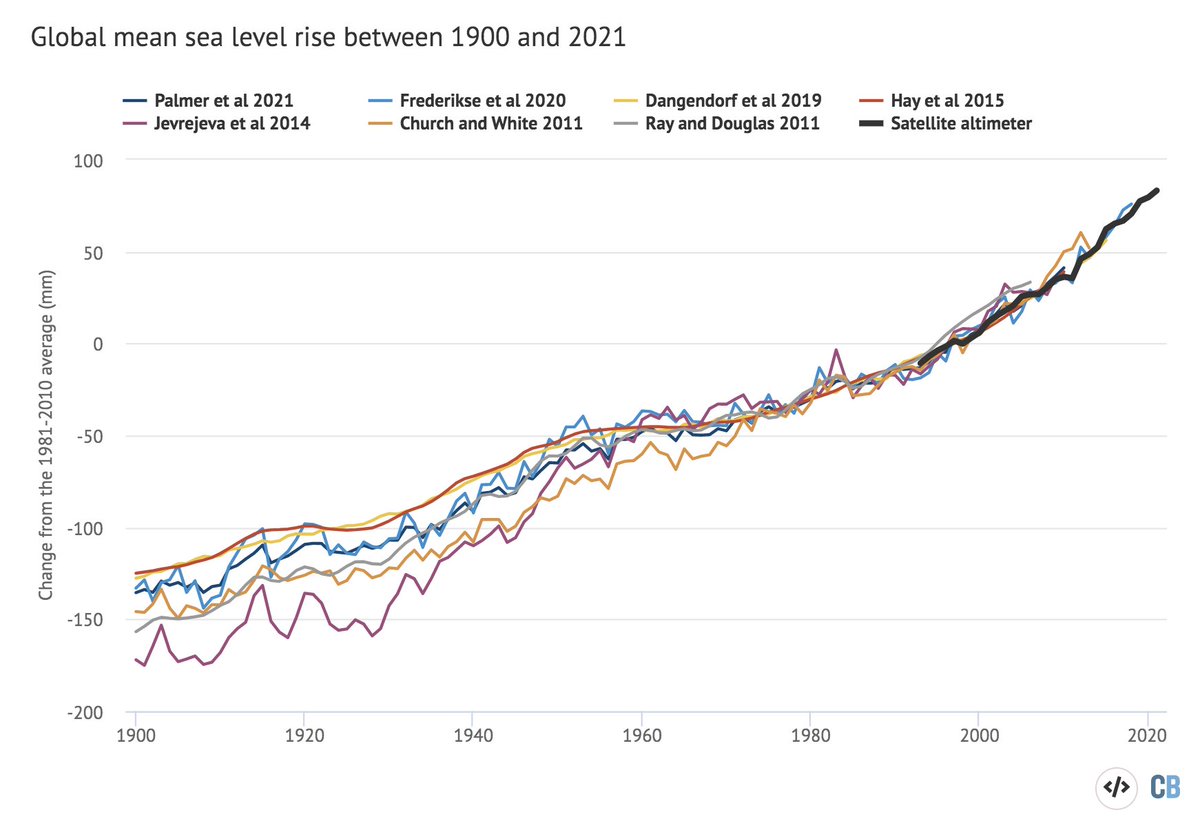
We saw record high sea levels in 2021. Global sea levels have risen by around 0.2 metres (200mm) since 1900, and there is evidence of accelerating sea level rise over the post-1993 period when high-quality satellite altimetry data is available.

The figure below shows the change in global average glacier mass from 1950 through to the end of 2020 (2021 values are not yet available). We see consistent loss of ice mass associated with warming temperatures:

Greenhouse gas concentrations reached a new high in 2021, driven by human emissions from fossil fuels, land use and agriculture. Methane concentrations in particular have seen a sharp rise over the past decade after a plateau in the 2000s.

Arctic sea ice was at the low end of the historical (1979-2010) range for most of 2021, but saw few new all-time daily low records set outside of brief periods in February and July. The summer minimum extent was the 12th lowest since records began in the late 1970s.

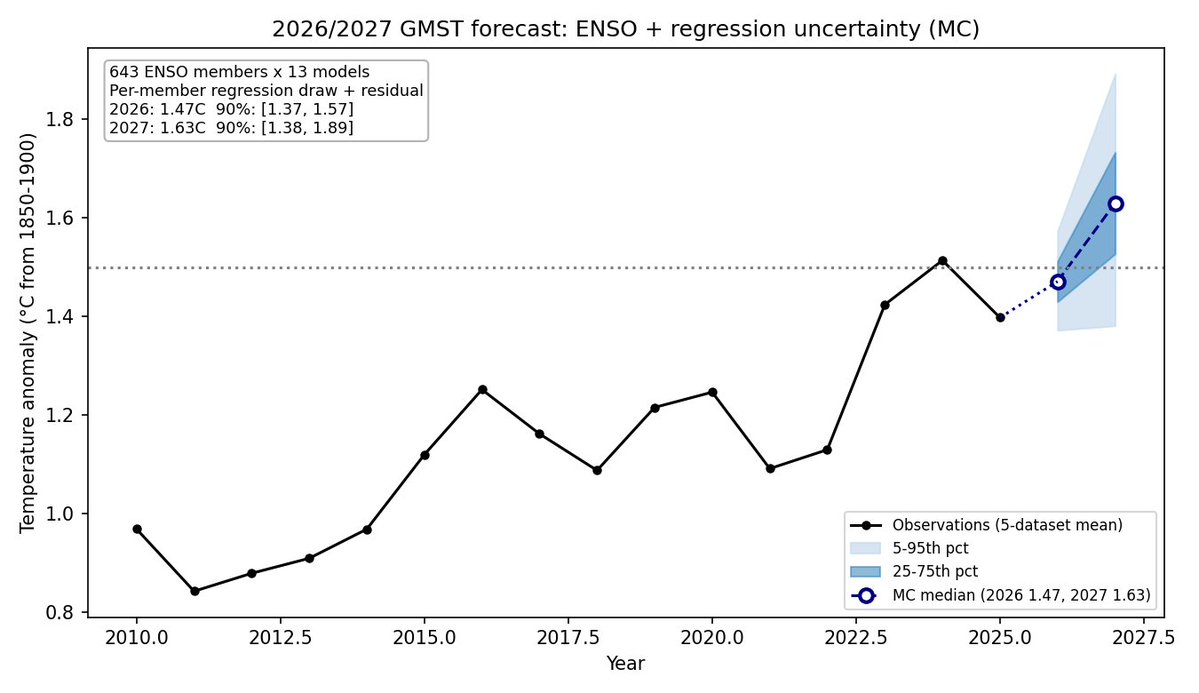
Finally, we can use current conditions (and El Nino/La Nina forecasts) to estimate where temperatures will end up in 2022. Four different groups (including a new @CarbonBrief estimate) have projections for 2022, and the differ a fair bit!

Our projection and that of the @metoffice has 2022 looking pretty similar to 2021, driven down a bit by the current "double dip" La Nina event. @BerkeleyEarth has it in the middle, while @ClimateOfGavin has 2022 threatening to top 2016 and 2020 as warmest year on record. 18/18
• • •
Missing some Tweet in this thread? You can try to
force a refresh