Is a single-cell RNA-seq atlas really an atlas? A short thread about #scRNAseq, maps, and atlantes (yes, the plural of atlas is atlantes! h/t @NeuroLuebbert). 🧵1/ 
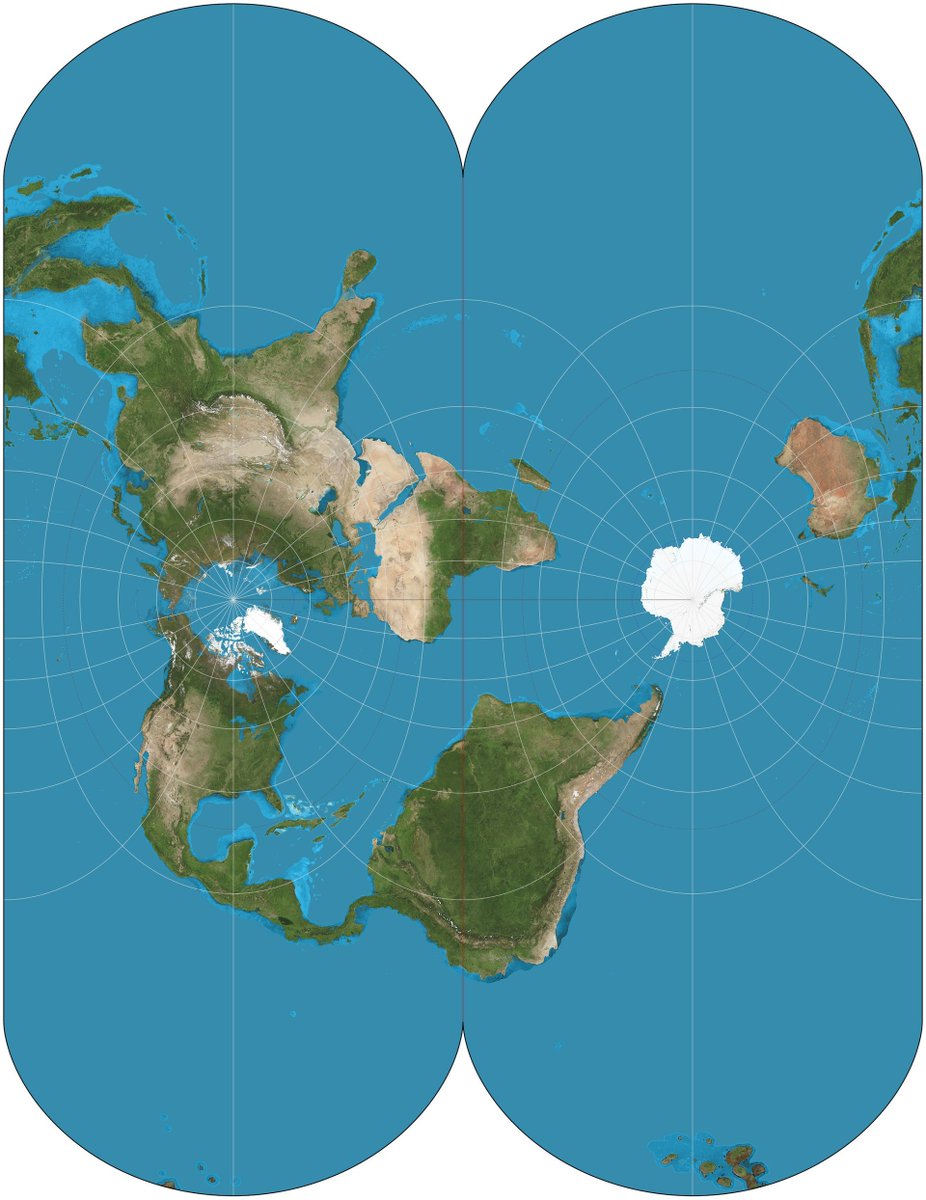
Atlantes must be accurate to be useful, and the vexing question for centuries, namely how to best represent the spherical earth in 2D, is nontrivial. There have been many proposals with pros & cons for each (because the sphere and the plane have different Gaussian curvatures). 2/


In #scRNAseq, atlases of cells have become synonyms with UMAP figures of gene expression matrices (used to be t-SNE but UMAP seems more popular now). Map making from gene expression matrices is more challenging than map making of our 3D world; #scRNAseq is in ~10⁴ dimensions. 3/

Mathematician George Pólya gave the following advice: "If you can't solve a problem, then there is an easier problem you can't solve: find it." This has been ignored in #scRNAseq, which wouldn't matter, except the method used for the general case fails on the simplest one.4/

Below is an example from a simple case. It's UMAP of a group of cells that are not in some huge dimension; here there are only 3 genes. The data was clustered with the popular "Leiden" method. The figure *seems* ok with the visual more or less confirming the clustering. 5/

But what was the actual example, the "ground truth" that this "atlas" represents? These were points selected uniformly at random on the sphere. No actual structure whatsoever. You can see how the UMAPs look for varying parameters: 6/
The Leiden clustering was performed on the uniformly sampled points. Of course the clusters consists of points that were close together, but their boundaries and shapes are meaningless... the points were sampled (densely) uniformly at random... 7/
How do people currently select parameters for the UMAPs they make? They tune with them until they get a picture that matches the clustering well...#confirmationbias 8/

You might wonder whether *any* of the choices of parameters produce a good map. All the atlantes are poor in this case. To see this, look what happens to an actual map of the world (points colored by continent ). Sometimes continents are broken apart, e.g. Africa in this case. 9/

Sometimes sea water is in mixed in with land (look at South America). 10/

No matter what parameters you choose, you'll see some semblance of the continents, but pretty much things are a mess. 11/
The chaos these projections can create is made clearer by omitting the ocean. Look at South American, which in reality is a "cell type" (continent) that is filled uniformly with cells, looking like a differentiation trajectory. 12/

At least in the above, South America is connected to North America. That is not always the case. 13/

Again, you'll find that varying parameters produces maps that, while in some cases better than others, all have major problems. 14/
UMAP author @leland_mcinnes describes it as "capturing the manifold underlying the data" by "stealing the singular set & geometric realization functors from algebraic topology & then adapting them to apply to metric spaces and fuzzy simplicial sets." 15/
umap-learn.readthedocs.io/en/latest/how_…
umap-learn.readthedocs.io/en/latest/how_…
Well, the sphere is a manifold? What exactly has UMAP captured?
Look, I love algebraic topology but throwing fancy math words around doesn't make a method have good properties. One needs theorems for that. 16/
Look, I love algebraic topology but throwing fancy math words around doesn't make a method have good properties. One needs theorems for that. 16/

UMAP is not just randomly placing high-dimensional points in the plane. In benchmarks we've done we see it preserves some structure (
https://twitter.com/lpachter/status/1431325969411821572?lang=en). But it's overall a poor heuristic. Ask yourself: next time you fly would you want your pilot navigating with a UMAP? 17/
Biologists have pushed back on criticisms of UMAP by saying that (to paraphrase), "of course they are not used for analysis, they are just hypothesis generating plots and all predictions must be validated". First of all, UMAP is used for analysis:
https://twitter.com/GorinGennady/status/1431720888009826306?s=2018/
Second, considering how expen$ive most experiments are in biology, and how much time they take, are graduate students really spend years in a lab chasing a UMAP generated hypothesis to confirm that it is real? 19/
This thread has focused on UMAP, but it also highlights problems with clustering. Here is a Leiden clustering of the continents (from points uniformly sampled within them, displayed with Mercator projection). Not terrible, but is Africa really two continents? 20/

The interaction between UMAP and the clustering makes a reasonably good clustering much worse. That's because it magnifies small differences. In many parameter choices below, blue and yellow like like two separate clusters. There's a "novel" cell type right there! 21/
In addition to all of these problems with single-cell atlantes, is also the problem that they are not "canonical", the way one would like an atlas to be.
https://twitter.com/lpachter/status/1431325992711180289?s=2022/
What should one produce instead of UMAP atlantes? There are many useful ways to visualize information, even geographic information, that can yield great insight. Turning statistics into art can be challenging, but it's important and useful. No need to be lazy. 23/

This thread was motivated by discussions with @IngileifBryndis, and inspired in part by the beautiful animations of @JEFworks (see
https://twitter.com/JEFworks/status/1483906029847220224?s=20). 24/
The UMAP analyses of this thread, and their visualizations and animations, were produced by @LambdaMoses. Her code used to make the figures is available here: github.com/lambdamoses/um… 25/25
? -> .
(annoying typo, the point is yes, the sphere is a manifold).
(annoying typo, the point is yes, the sphere is a manifold).
• • •
Missing some Tweet in this thread? You can try to
force a refresh