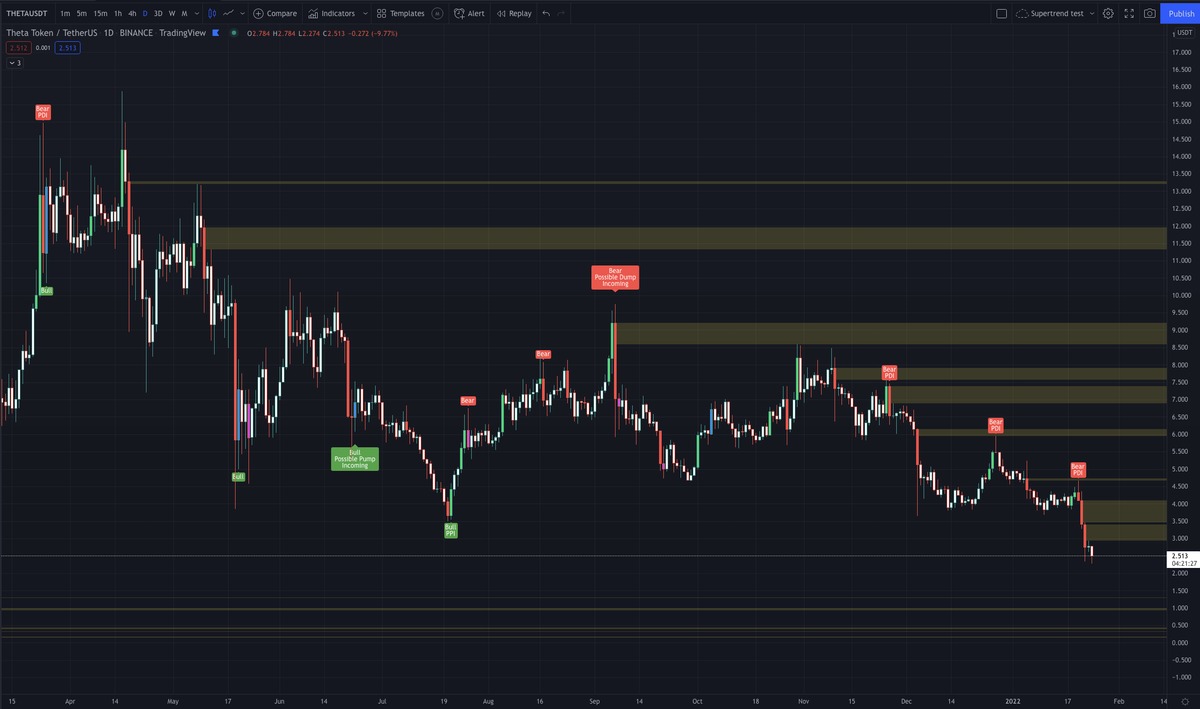
Vector Candle Reversals are very powerful. That's why I had this indicator made.
Look at $AXS here at it's peak price. How many Bullish vs Bearish VCRs do you see? If i'd had this indicator at the time I would have called a dump incoming on it.
Same play as always:
Take out the top of the range first and you target the bottom, take out the bottom of the range then you target the top.
Note: $Eth range isn't confirmed until a break below $1557.65 has occurred.
Price moving towards the top of the range at the moment. Will be careful if this turns out to sweep the range high first - have to remember that we're in the vicinity of a bullish order block and the fact there's a lot of fuckery around the weekend. If it does take range high...
...i'd like confirmation by it re-entering the range and holding within. A move back up above again and i'd be vigilant to make sure it doesn't go against me too hard.
For scalp ranges I am always looking for a minimum of 3:1 RR.
Notice and observe how whenever we drop people start searching for lower and lower targets.
Was this the case a few months ago? No, people were looking for higher targets until all hope was obliterated.
There was a sentiment shift when we dropped below 28k.
Hope turned to despair.
People who had been trying to buy/long the dip were now more of the thought of selling/shorting the rips.
Towards the end of the move is when people start getting aggressive with even lower or higher targets.
Know when the market structure has shifted, we are very much in bullish market conditions - yet the crowd is still very much with a bearish mindset. Most are offside.
2/ What's the first thing people learn when they start trading?
Technical analysis of the chart. Usually through some sort of patterns system, Fibonacci, Elliot Waves, Fair Value Gaps for example.
But what is something is consistently overlooked?
Time.
3/ Time is important because it's when the Market Makers and the algorithms are most active in the market. You'll see this through sessions whereby most of the activity in the charts happens whenever the key legacy sessions are open. These are Asia, London and New York