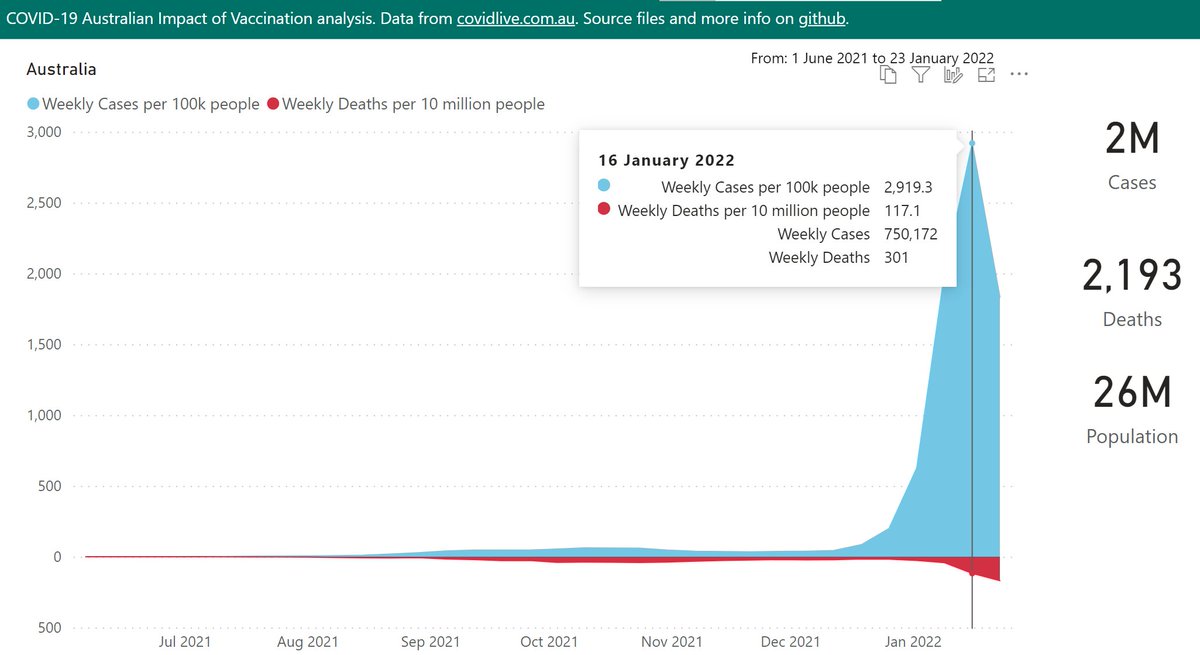
Here's an analysis of cases and deaths, for Australia, then state-by-state.
I couldn't bear to post this last week as the case rate was one of the worst in the world (with WA at near-zero). That seems to have been the peak.
The death rate continues to increase.
I couldn't bear to post this last week as the case rate was one of the worst in the world (with WA at near-zero). That seems to have been the peak.
The death rate continues to increase.
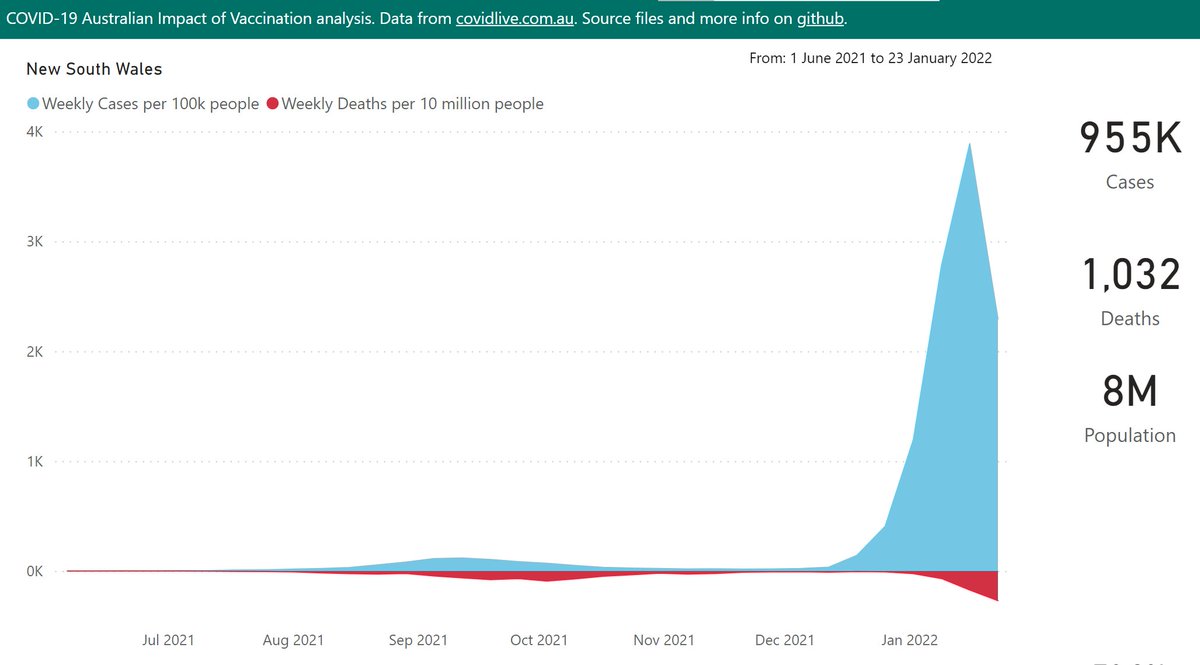
New South Wales is the worst affected state, where the case rate rose to just under 4,000 per 100K population. If NSW was a country, that would've been the highest rate globally for any comparable country.
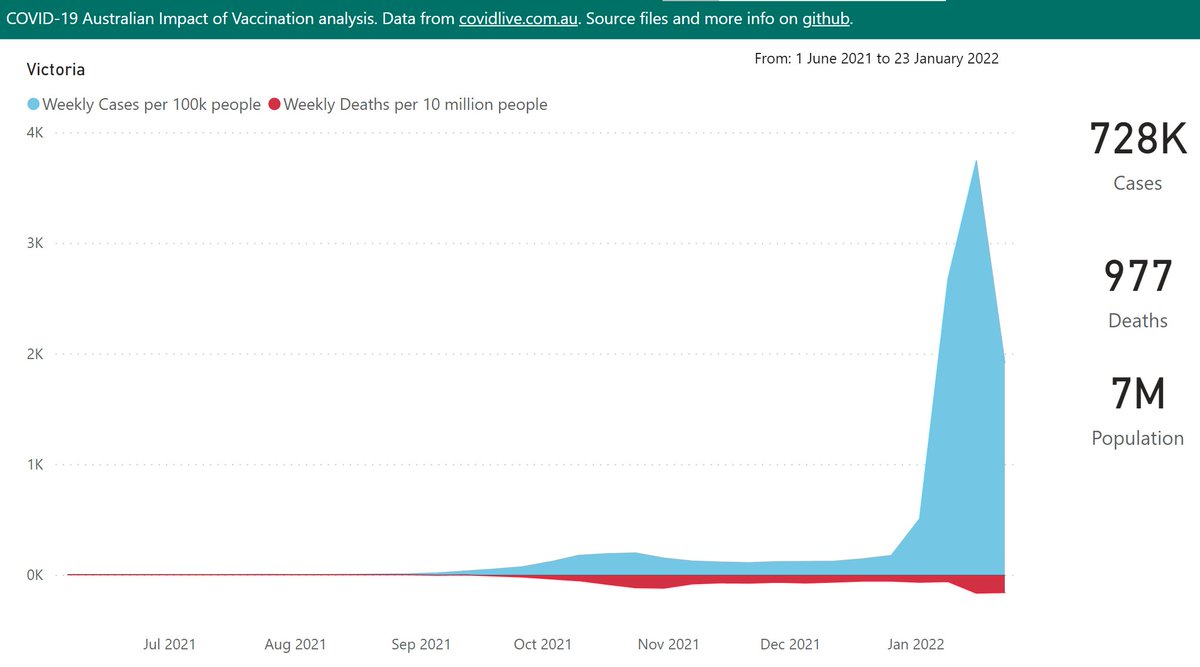
Victoria rose to a similar level, just slightly lower on this "per population" basis.
The rise in cases was even steeper than in NSW, so the impact of that on deaths is likely yet to come.
The rise in cases was even steeper than in NSW, so the impact of that on deaths is likely yet to come.
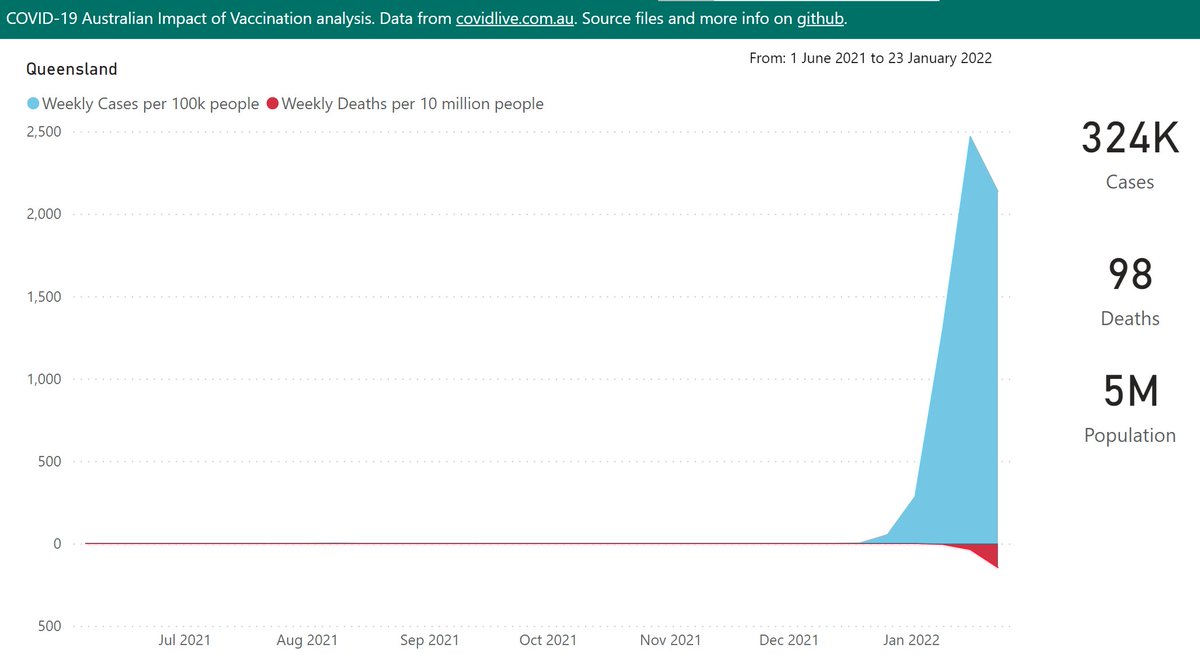
Queensland's chart is just breathtaking - rising from "COVID-zero" to among the highest case rates in the world in just a few weeks.
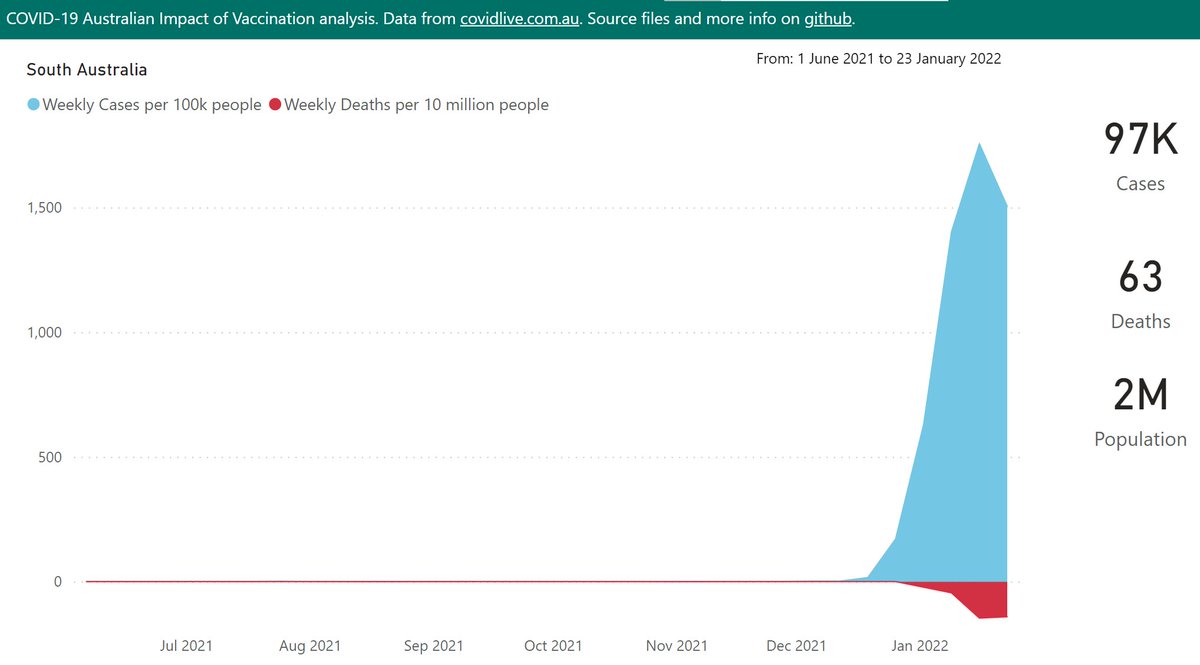
South Australia's peak for cases was somewhat lower than in the states shown above (but still breathtaking, following years of "COVID zero" life).
It is noticeable that the death rate there (relative to cases) seems much higher compared to other states.
It is noticeable that the death rate there (relative to cases) seems much higher compared to other states.
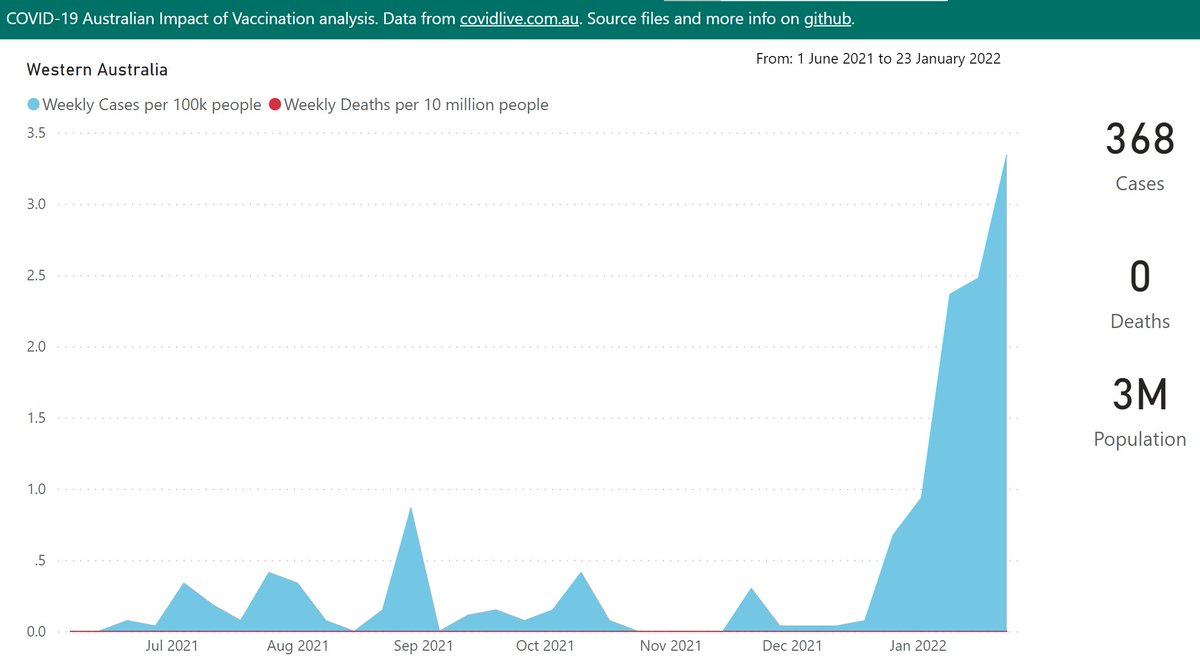
In Western Australia, years of "COVID zero" life and economic success are under threat from a community Omicron outbreak.
Hopefully the NPI measures applied can limit the impact.
Hopefully the NPI measures applied can limit the impact.
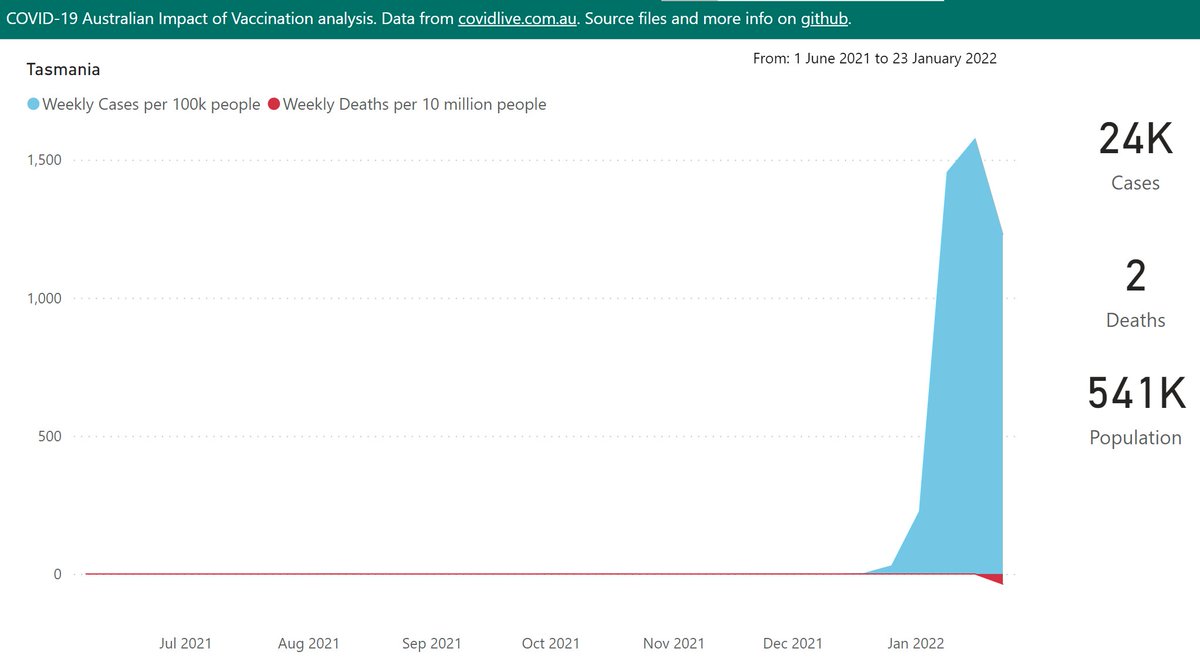
Tasmania's Omicron wave appears to have peaked - at about the same case rate as South Australia.
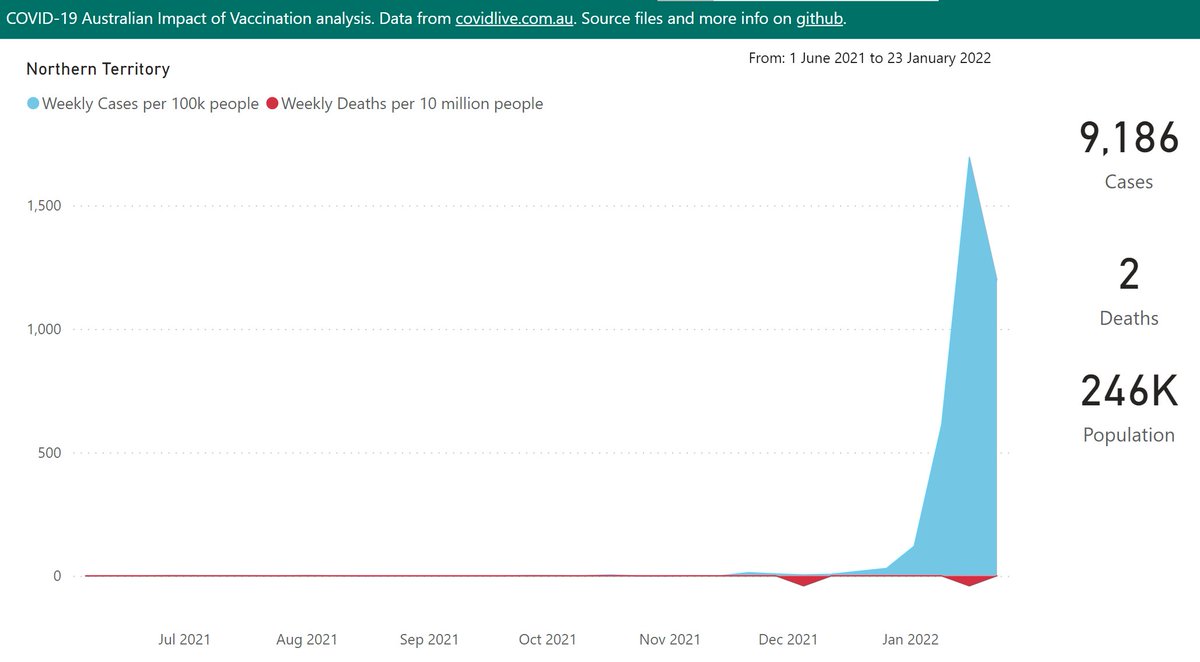
The Omicron peak in the Northern Territory was only slightly higher than SA & TAS (on a population basis).
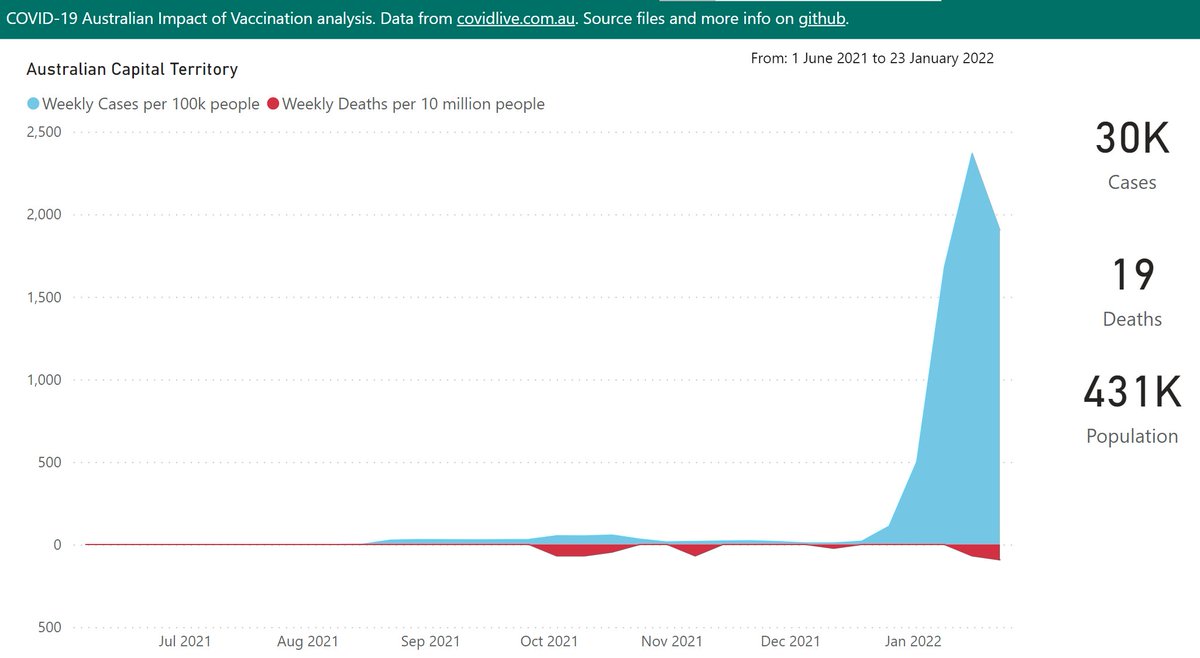
In the Australian Capital Territory, the long, smouldering Delta outbreak has been absolutely swamped by Omicron. The peak in cases was a bit lower than that in NSW.
COVID-19 stats from @covidliveau.
• • •
Missing some Tweet in this thread? You can try to
force a refresh