Estimates suggest that around 1-in-3 children globally suffer from lead poisoning.

It's a problem that:
– is widespread
– largely invisible & overlooked
– we spend little $$ on
– have large gaps in understanding

Our new @OurWorldInData project 🧵👇

ourworldindata.org/reducing-lead-…
@OurWorldInData Lead is a toxic pollutant. Exposure affects the nervous system, and is linked to delays in brain development & cognitive function.

It's particularly bad for young children.

The IHME estimates that lead pollution is responsible for around 1% of the global disease burden.

1/
The biggest source of lead used to be from gasoline.

The world has now phased out leaded petrol. A great achievement.

Algeria became the last country to do so, last year.

2/

ourworldindata.org/leaded-gasolin…
This led to massive reductions in lead exposure across many countries.

In the US, estimates suggest median blood levels in children have fallen by 95%.

3/

ourworldindata.org/decline-lead-p…
But, large numbers of children are still exposed to high levels of lead in many countries.

Where does this lead come from?

Some sources are easier to identify and tackle than others.

4/
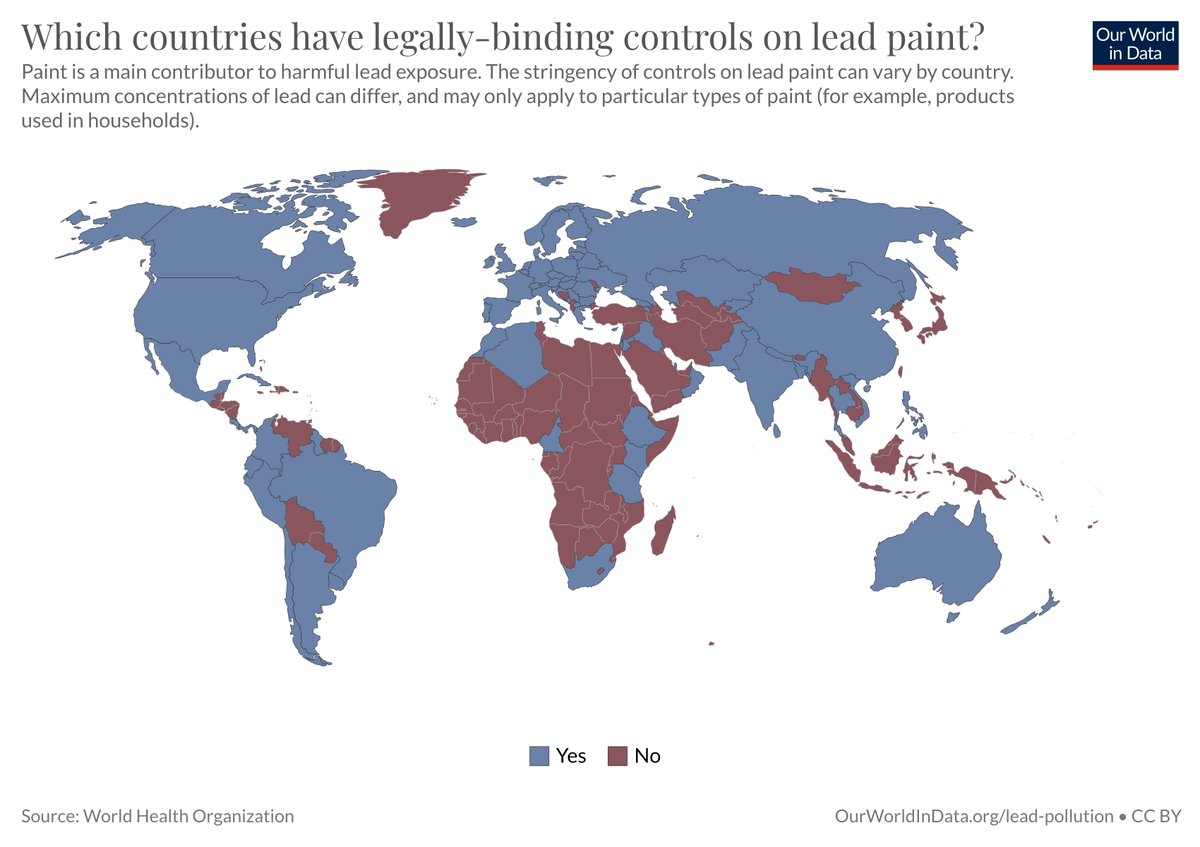
Many countries have regulatory limits on the use of lead in paints. But many do not. Lead concentrations in paints are very high as a result.

@LeadElimination is one non-profit that is focused on tackling this problem: leadelimination.org

5/
But there are other sources that we know much less about: batteries, electronic waste, even food spices.

This is a big unknown that needs more research on how large these sources are, and how easy they might be to tackle.

6/
Last year the charity evaluator @GiveWell gave its first grant to a lead project.

It stressed that:
– we spend little on this problem
– could be very cost-effective to tackle
– but large uncertainty about the sources of lead & how we tackle them

givewell.org/research/incub…
@GiveWell In our @OurWorldInData work on Lead Pollution we want to make the latest data on this global problem available & accessible.

I have published this here: ourworldindata.org/lead-pollution

/end

• • •

Missing some Tweet in this thread? You can try to force a refresh
 

Keep Current with Hannah Ritchie

Hannah Ritchie Profile picture

Stay in touch and get notified when new unrolls are available from this author!

Read all threads

This Thread may be Removed Anytime!

PDF

Twitter may remove this content at anytime! Save it as PDF for later use!

Try unrolling a thread yourself!

how to unroll video
  1. Follow @ThreadReaderApp to mention us!

  2. From a Twitter thread mention us with a keyword "unroll"
@threadreaderapp unroll

Practice here first or read more on our help page!

More from @_HannahRitchie

Jan 18
In the environmental space it’s very common for us to be nostalgic for a past that we imagine to be sustainable.

We see our lack of sustainability as a modern problem.

Unfortunately there is no sustainable world to rewind back to.

🧵👇
This is because we forget that there are two halves to the sustainability definition:


“Meet the needs of the present”


“without sacrificing the needs of future generations”

We focus a lot on the 2nd half & forget the 1st.

1/
Even if we pretend that humanity’s impact on the environment used to be small (it didn’t, at least on a per capita basis)…


We have always failed to meet the needs of the present generation.

2/
Read 5 tweets
Jan 17
Share of cereals used for human food (vs. animal feed or biofuels):

🌎 Globally: 48%

🇮🇳 India: 93%
🇲🇼 Malawi: 90%
🇯🇵 Japan: 57%
🇨🇳 China: 48%
🇬🇧 UK: 38%
🇧🇷 Brazil: 28%
🇪🇺 EU: 26%
🇪🇸 Spain: 18%
🇨🇦 Canada: 16%
🇺🇸 USA: 11%
🇩🇰 Denmark: 10%

ourworldindata.org/grapher/share-…
Explore the data for any country, and over time 👇

Share of cereals used for livestock feed: ourworldindata.org/grapher/share-…

Share of cereals allocated for industrial uses (mainly biofuels): ourworldindata.org/grapher/share-…
The evolution of cereal allocation in the US is interesting.

Biofuels have increased rapidly
📈 10% in 2000 ➡️ 47% in 2017

Meaning the share allocated to animal feed has declined
📉 72% in 2000 ➡️ 42% in 2017
Read 4 tweets
Dec 13, 2021
A topic where I see one of the biggest gaps between public opinion & recommendations from scientists is palm oil 🌴🦧

Companies often boycott palm oil to look sustainable to consumers. But a ban is rarely the recommendation from experts.

🧵on why it's a complex topic
Global palm oil production has increased rapidly over the last few decades.

Most palm oil is grown in Indonesia and Malaysia. Together they produce around 85% of the world's palm oil.

1/
Increased production of palm oil has meant increased demand for agricultural land.

[Although as we'll see later, not as much as we'd expect]

2/
Read 13 tweets
Nov 6, 2021
It's Nature Day at #COP26

There are many win-win solutions for climate, land use and biodiversity.

Most relate to food: what we choose to eat and how we produce it.

Here's some of our work from @OurWorldInData on these topics 🧵👇
If we want to stop climate change we must transition away from fossil fuels. There's no way around that.

But we also can't solve it without addressing food.

Emissions from food alone could take us past our carbon targets

ourworldindata.org/food-emissions…
One-quarter to one-third of global greenhouse gas emissions come from the food system.

ourworldindata.org/greenhouse-gas…
Read 14 tweets
Nov 4, 2021
It's a big day at #COP26 as more countries pledge to phase out coal power.

I'm trying to track and map these pledges here 👇
ourworldindata.org/grapher/coal-p…

Will continue to update over the day as more details emerge.
Countries that we think will be added, but awaiting confirmation and target dates:
🇧🇼 Botswana
🇧🇳 Brunei
🇮🇩 Indonesia
🇰🇿 Kazakhstan
🇱🇮 Liechtenstein
🇲🇻 Maldives
🇲🇦 Morocco
🇵🇭 Philippines
🇸🇳 Senegal
🇸🇬 Singapore
🇰🇷 South Korea
🇱🇰 Sri Lanka
🇻🇳 Vietnam
🇿🇲 Zambia
A big thank you to people including @EmberClimate, @CoalFreeDave, @leonickroberts, @sasj & others who I'm following to try to keep up-to-date! If you're interested in this space, they are all great follows.
Read 5 tweets
Nov 4, 2021
🆕🌡 The 2021 Global Carbon Budget from @gcarbonproject is out.

We've just now updated all of our CO₂ data on @OurWorldInData with the new release.

It should offer you a quick and easy way to explore all of the results 🧵👇

ourworldindata.org/grapher/global…
The easiest way to explore all of the data is in our @OurWorldInData CO₂ Data Explorer.

Switch between:
➔ Annual
➔ Per capita
➔ Cumulative
➔ Consumption-based
➔ Emissions by fuel
➔ CO₂ intensity (per $)

Explore it here: ourworldindata.org/explorers/co2
The @gcarbonproject make their data open-access, and so do we.

That means you can take any of our charts or download the data from any chart and use it for anything you find useful. No need to ask.

Here I show you how to do this 👇
Read 4 tweets

Did Thread Reader help you today?

Support us! We are indie developers!


This site is made by just two indie developers on a laptop doing marketing, support and development! Read more about the story.

Become a Premium Member ($3/month or $30/year) and get exclusive features!

Become Premium

Too expensive? Make a small donation by buying us coffee ($5) or help with server cost ($10)

Donate via Paypal

Or Donate anonymously using crypto!

Ethereum

0xfe58350B80634f60Fa6Dc149a72b4DFbc17D341E copy

Bitcoin

3ATGMxNzCUFzxpMCHL5sWSt4DVtS8UqXpi copy

Thank you for your support!

Follow Us on Twitter!

:(