Timothée Parrique Profile picture
Jan 26, 2022 18 tweets 6 min read Read on X
Latest numbers on carbon inequality by @lucas_chancel.

THREAD
Close to half of all emissions since the industrial revolution have been produced since 1990, the year of the first report by the Intergovernmental Panel on Climate Change (IPCC).
At current global emissions rates, the 1.5°C budget will be depleted in 6 years and the 2°C budget in 18 years. The per capita sustainable budget compatible with the 1.5°C limit is 1.1 tonne of CO2 per annum per person, i.e. about 6 times less than the current global average.
There is a close link between per capita income and emissions, but this link is not perfect: certain regions are more effective than others in limiting emissions associated with a given level of income.
Population is not the main driver of emissions.
When measuring emissions, watch out for imports and exports. For example, Europe’s carbon footprint (including imported/exported emissions) is 23% higher than its territorial emissions (excluding imported/exported emissions).
Carbon inequalities within regions are even larger than carbon inequalities between regions.
The main driver of emission is wealth. At 31.2 tCO2/year/cap, the 10% global richest are responsible for nearly half of total emissions. Compare this to the poorest half of humanity who only represent 12% of total emissions.
The size of the colored areas is proportional to population, showing the extent of carbon inequality, and the fact that only a few people enjoy high-carbon lifestyles.
Since 1990, average global emissions per capita grew by about 7% (and overall emissions grew by 58%), but that average hides wide disparities.
The 10% global richest are responsible for 45% of emission growth since 1990.
Luxury emissions is not only yachts, jets, and other purchased goods and services, it’s also emissions from the assets that they own.
In 1990, carbon inequality was mostly inequality between rich, high-emission and poor, low-emission COUNTRIES. In 2019, the situation has changed: 63% of global inequality is due to differences within countries between rich, high-emission and poor, low-emission CLASSES.
In rich countries, the bottom 50% is already below the 2030 per capita target (in the US, for example), or very close to it (France). It follows that all emissions reductions efforts should be made by the top half of the distribution.
Different situation in emerging countries.
The existence of carbon inequality means we should apply different objectives and instruments to different population. To put it in a nutshell: degrowth for the rich, green growth for the poor.
For example, a steeply progressive tax rates on polluting stock ownership. Applying a 10% tax rate on the value of carbon assets owned by multimillionaires would generate $100bn per year, about 1.5 times the current estimated annual costs of adaptation for developing countries.
What these numbers show is that the global ecological crisis is not a specie-problem, as the term Anthropocene may suggest; it is rather an issue of wealth concentration where accumulation becomes the main driver of deterioration.

END THREAD/

wid.world/document/clima…

• • •

Missing some Tweet in this thread? You can try to force a refresh
 

Keep Current with Timothée Parrique

Timothée Parrique Profile picture

Stay in touch and get notified when new unrolls are available from this author!

Read all threads

This Thread may be Removed Anytime!

PDF

Twitter may remove this content at anytime! Save it as PDF for later use!

Try unrolling a thread yourself!

how to unroll video
  1. Follow @ThreadReaderApp to mention us!

  2. From a Twitter thread mention us with a keyword "unroll"
@threadreaderapp unroll

Practice here first or read more on our help page!

More from @timparrique

Sep 19, 2024
Karma moment in science. Two weeks ago, @IvanVSavin & @ProfJeroenBergh published a (flawed) review of the degrowth literature arguing that there were « very few studies using formal modelling ». This week, Lauer et al. published a study showing that this is wrong. 🧵
Systematically reviewing the literature from 2000 to 2023, Arthur Lauer and his colleagues identify 75 modelling studies. Image
Savin and van den Bergh (2024) argue that « the fraction of studies undertaking modelling or data analysis fluctuates in the range of 0-15% over tiem shows no clear trend » (p.3). Wrong again.
Read 6 tweets
Nov 24, 2023
Today is Black Friday, a nonsensical ritual invented by for-profit businesses for the sole sake of moneymaking. By shopping today, you are willingly enriching a small class of business-owning super-polluters who bath in ecosystem-killing profits. Image
The top 10% richest humans own 76% of world wealth and generate 50% of all carbon emissions. The footprint of the world top 1% equals the one of the poorest 66% of humanity.
We are told that consuming forever more is part of human nature. Bullshit. The seemingly inescapable rat-race for positional prestige is constructed by an army of influencers, growth hackers, and ads designers. Read it again: the destruction of life on Earth is designed.
Read 10 tweets
Jun 5, 2023
Of course that's your contention. You're an economist who just heard about degrowth. You just got finished reading some quick-and-dirty critique – the latest piece in The Economist probably – and you’re convinced that degrowth is unnecessary because we can green growth. Image
You’re gonna be convinced of that ‘til next month when you read "Decoupling Debunked", then you’re going to admit that decoupling has never happened in the past but you’ll say that it could sure happen in the future. Image
That’s going to last until next year when you’ll be regurgitating Andrew McAfee, Sam Fankhauser, or Alessio Terzi about how price signals and technological progress can solve any environmental issue. Image
Read 9 tweets
May 23, 2023
Le rapport de @pisaniferry pour @Strategie_Gouv est criblé d'erreurs sur la décroissance. 🧵 Image
Sobriété = consommer moins. Croissance = produire & consommer plus. J'ai du mal à voir en quoi consommer moins nous mènera à consommer plus... Image
Pour mieux comprendre le lien entre décroissance et sobriété.

timotheeparrique.com/sufficiency-me… Image
Read 10 tweets
May 16, 2023
Summary of my talk at the #BeyondGrowth conference on the impossibility of green growth and the necessity of degrowth. 🧵 Image
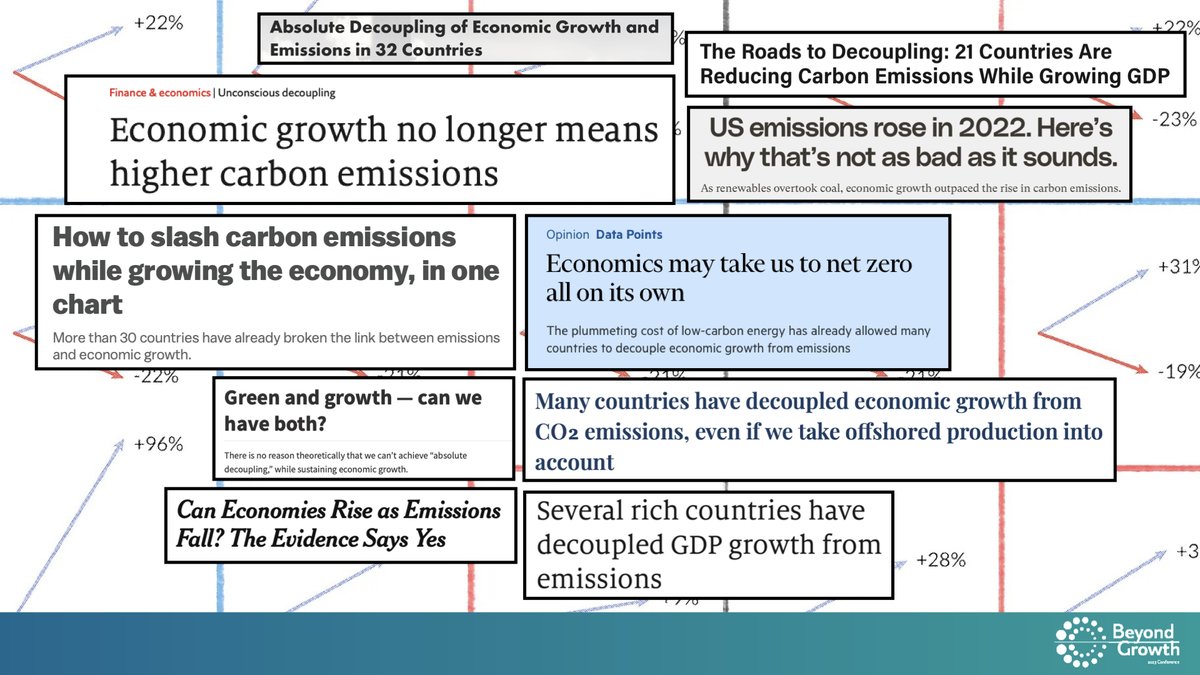
There is a rumour that is picking up speed in the media, affirming that it is possible to both produce more while polluting less. Some people call it “green growth.” Image
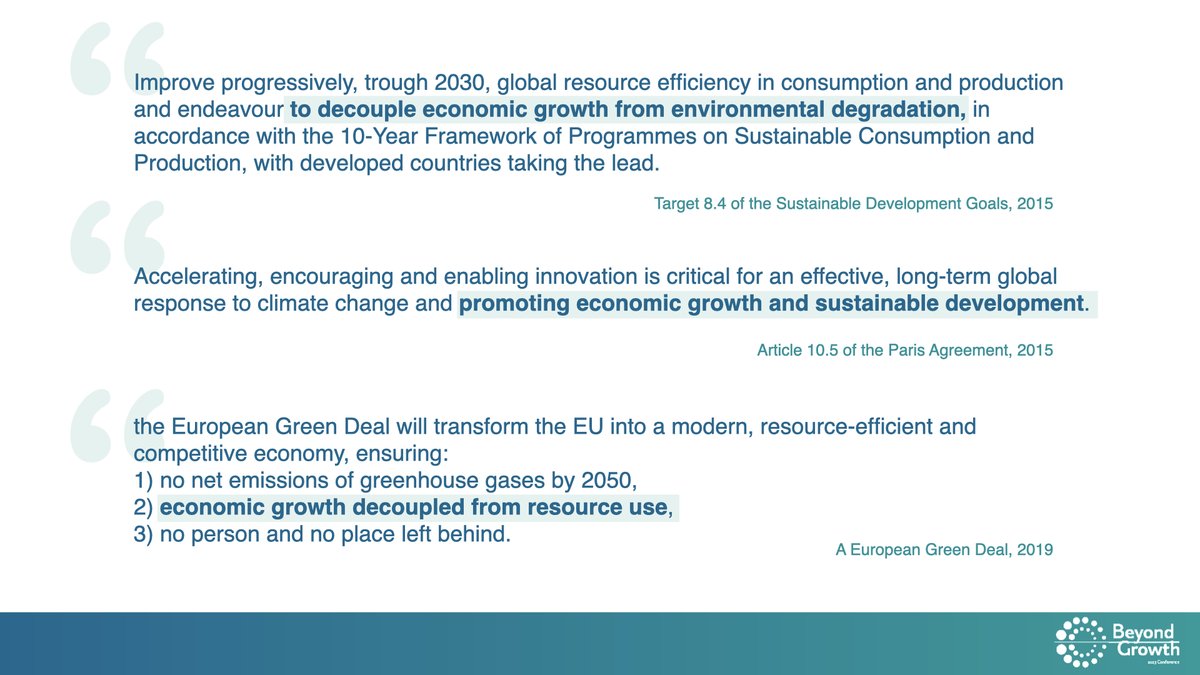
This rumour is not only a rumour, it is also a belief deeply embedded within our current environmental strategies. Problem: The idea of an economic growth fully decoupled from nature is scientifically baseless and it is distracting us from more effective transition strategies. Image
Read 17 tweets
Mar 24, 2023
Est-ce que le dernier apport du #giec parle de décroissance ? OUI. Trois articles pour comprendre le lien entre climat, sobriété, et décroissance. 🧵
Analyse du volet n°3 de l'AR6 du #giec sur l'atténuation du changement climatique.

timotheeparrique.com/degrowth-in-th…
Analyse du volet n°2 de l'AR6 du #giec sur l'adaptation au changement climatique.

timotheeparrique.com/degrowth-in-th…
Read 4 tweets

Did Thread Reader help you today?

Support us! We are indie developers!


This site is made by just two indie developers on a laptop doing marketing, support and development! Read more about the story.

Become a Premium Member ($3/month or $30/year) and get exclusive features!

Become Premium

Don't want to be a Premium member but still want to support us?

Make a small donation by buying us coffee ($5) or help with server cost ($10)

Donate via Paypal

Or Donate anonymously using crypto!

Ethereum

0xfe58350B80634f60Fa6Dc149a72b4DFbc17D341E copy

Bitcoin

3ATGMxNzCUFzxpMCHL5sWSt4DVtS8UqXpi copy

Thank you for your support!

Follow Us!

:(