YouGov Profile picture
Jan 26, 2022 8 tweets 4 min read Read on X
YouGov's @MilanDinic1 has conducted an extensive study on drugs in the UK, looking at opinions, attitudes, and behaviours towards both recreational and prescription use

Key points below 👇

yougov.co.uk/topics/lifesty…
81% of Britons think drug abuse is a big problem in the UK - and half (53%) see it as big problem in their local area

yougov.co.uk/topics/lifesty… Image
Overall Britons think drug laws in the UK are...

Too lenient: 40%
Too strict: 19%
About right: 24% Image
Who has taken recreational drugs before?

25-39 yr olds: 52% say they have
40-59: 49%
General population: 39%
16-24 yr olds: 26%
60+ yr olds: 24%

yougov.co.uk/topics/lifesty… Image
Of the 39% of Britons who say they've taken recreational drugs, which have they tried..?

Cannabis: 93%
Cocaine: 34%
Ecstacy: 27%
MDMA: 24%
Amphetamine: 23%
Hash: 23%
Mushrooms: 21%
LSD: 19%
Ketamine: 11%
Opium: 4%
Crack: 3%
Herion: 3%
Glue: 3%

yougov.co.uk/topics/lifesty… Image
Most Britons (56%) say they currently take prescription drugs

yougov.co.uk/topics/lifesty… Image
Tory voters (43%) are twice as likely as Labour voters (19%) to say that drug addiction is mostly a result of personal choice

yougov.co.uk/topics/lifesty… Image
Labour voters are more likely to think people with drug addiction problems should be dealt with by the NHS, while Conservative voters say it should be the police and the courts

yougov.co.uk/topics/lifesty… Image

• • •

Missing some Tweet in this thread? You can try to force a refresh
 

Keep Current with YouGov

YouGov Profile picture

Stay in touch and get notified when new unrolls are available from this author!

Read all threads

This Thread may be Removed Anytime!

PDF

Twitter may remove this content at anytime! Save it as PDF for later use!

Try unrolling a thread yourself!

how to unroll video
  1. Follow @ThreadReaderApp to mention us!

  2. From a Twitter thread mention us with a keyword "unroll"
@threadreaderapp unroll

Practice here first or read more on our help page!

More from @YouGov

Jul 9
18% of Britons say they are likely to consider voting for a new left-wing party led by Jeremy Corbyn

However, this is less than would consider voting for the existing major parties and has caveats... 🧵 Image
Just 32% of those who would consider voting for a Corbyn-led party say it is the party they are most likely to consider voting for, including only 9% saying it is the only party they would consider voting for (of the main national parties)

yougov.co.uk/politics/artic…Image
Which other parties would those considering a Corbyn-led party also be open to voting for?

Greens: 70%
Labour: 51%
Lib Dems: 48%
Reform UK: 11%
Conservatives: 5%

yougov.co.uk/politics/artic…Image
Read 4 tweets
Jul 2
Top 5 reasons that 26% of 2024 Conservatives have defected to Reform UK in the year since the 2024 election

1. Trust them more on immigration: 56%
2. All other parties are worse: 41%
3. Better at standing up for people like me: 36%
4. Closer to my values: 25%
5. Better placed to win next election: 24%Image
Compared to those sticking with the party, Conservative defectors to Reform UK are more likely to be men (58% vs 44%), more likely to have voted Leave (80% vs 61%) and are older (83% are over 50 vs 75%)

yougov.co.uk/politics/artic…Image
While Conservative losses to Reform UK are more likely than loyalists to see immigration as a top issue facing the country (88% vs 64%), the two groups do not otherwise differ hugely on what are currently the most pressing problems in the UK

yougov.co.uk/politics/artic…Image
Read 6 tweets
Mar 6
🧵Our major new study looks at European attitudes on Ukraine, Trump, and defence

Net favourability of...
Donald Trump
UK: -65
Spain: -56
France: -53
Italy: -36

Volodymyr Zelenskyy
UK: +57
France: +17
Spain: +17
Italy: -15

Vladimir Putin
UK: -85
Spain: -83
France: -73
Italy: -63Image
Most Western Europeans see Donald Trump as a big threat to peace and security in Europe

UK: 78% very/fairly big threat
Spain: 75%
Germany: 74%
France: 69%
Italy: 58%

yougov.co.uk/international/…Image
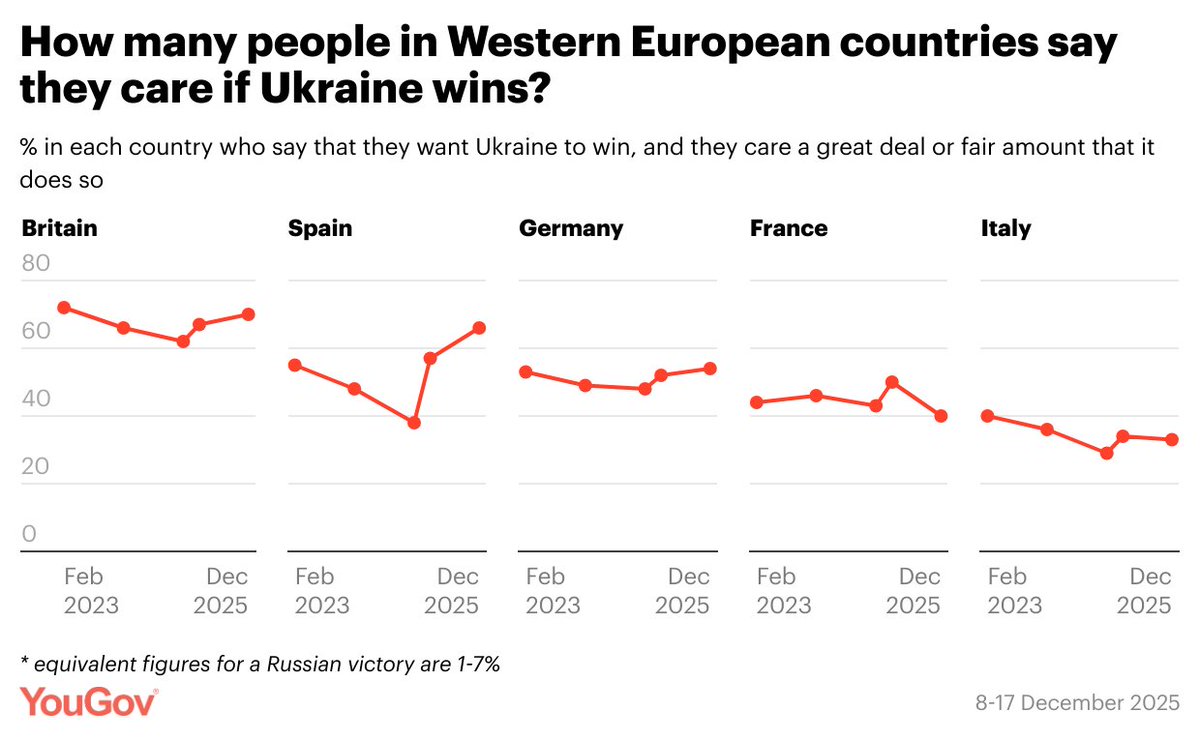
How many people in Western Europe say they want Ukraine to win and care that it does so?

UK: 67%
Spain: 57%
Germany: 52%
France: 50%
Italy: 34%

yougov.co.uk/international/…Image
Read 9 tweets
Mar 5
In 2.5 weeks, Donald Trump has gone from a +38 net favourability rating among Reform UK voters to -8

All Britons
Favourable: 15% (-7 from 16-17 Feb)
Unfavourable: 80% (+7)

Reform UK voters
Favourable: 45% (-21)
Unfavourable: 53% (+25)Image
Following the recent row with Donald Trump in the Oval Office, Ukrainian president Volodymyr Zelenskyy's reputation has improved in the UK

Favourable: 71% (+7 from 16-17 Feb)
Unfavourable: 14% (-2)

yougov.co.uk/politics/artic…Image
Attitudes towards Keir Starmer have improved following his successful US visit and handling of the Ukraine conflict

Favourable: 31% (+5 from 16-17 Feb)
Unfavourable: 59% (-7)

yougov.co.uk/politics/artic…Image
Read 4 tweets
Feb 26
A majority in all seven of our EuroTrack countries say immigration has been too high nationally

🇩🇪 81% say too high
🇪🇸 80%
🇸🇪 73%
🇬🇧 71%
🇮🇹 71%
🇫🇷 69%
🇩🇰 55% Image
% saying immigration is one of the two top issues facing their country

🇩🇪 42% (ranks 1st on issues list)
🇬🇧 33% (3rd)
🇪🇸 31% (2nd)
🇫🇷 28% (2nd)
🇸🇪 23% (3rd)
🇮🇹 17% (=4th)
🇩🇰 15% (4th)

yougov.co.uk/international/…Image
The plurality view across our 7 Eurotrack nations is that immigration has been bad for their country

🇮🇹 56% bad for country
🇩🇪 55%
🇫🇷 52%
🇸🇪 51%
🇪🇸 46%
🇬🇧 42%
🇩🇰 41%

yougov.co.uk/international/…Image
Read 4 tweets
Feb 11
🧵/ Where does the British public stand on transgender rights in 2024/5?

The 4th study in our series shows that scepticism has grown across the board over the last two years, including among groups typically more sympathetic to trans people Image
On transgender social/legal status, % of Britons think...

Social
Should be able to identify as a different gender: 49% (-6 from 2022)
Should not be able to identify as a different gender: 35% (+10)

Legal
Law should allow people to change legal gender: 34% (-6)
Law should not allow people to change legal gender: 48% (+11)

yougov.co.uk/politics/artic…Image
As many Britons now say you should be able to change *neither* your social nor legal gender as say you should be able to change *both*

Should be able to change neither: 33% (+10 from 2022)
Should be able to change both: 32% (-6)
Change social, but not legal: 10% (-1)
Change social, unsure on legal: 7% (+1)
Unsure on both: 11% (-5)
Other combos: 8% (+1)

yougov.co.uk/politics/artic…Image
Read 11 tweets

Did Thread Reader help you today?

Support us! We are indie developers!


This site is made by just two indie developers on a laptop doing marketing, support and development! Read more about the story.

Become a Premium Member ($3/month or $30/year) and get exclusive features!

Become Premium

Don't want to be a Premium member but still want to support us?

Make a small donation by buying us coffee ($5) or help with server cost ($10)

Donate via Paypal

Or Donate anonymously using crypto!

Ethereum

0xfe58350B80634f60Fa6Dc149a72b4DFbc17D341E copy

Bitcoin

3ATGMxNzCUFzxpMCHL5sWSt4DVtS8UqXpi copy

Thank you for your support!

Follow Us!

:(