* Suicidology Quiz: The Answer *
Two days ago, I posted a quiz:
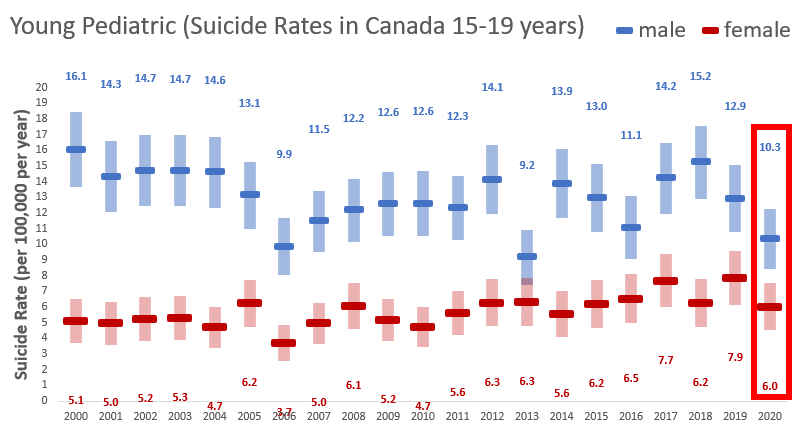
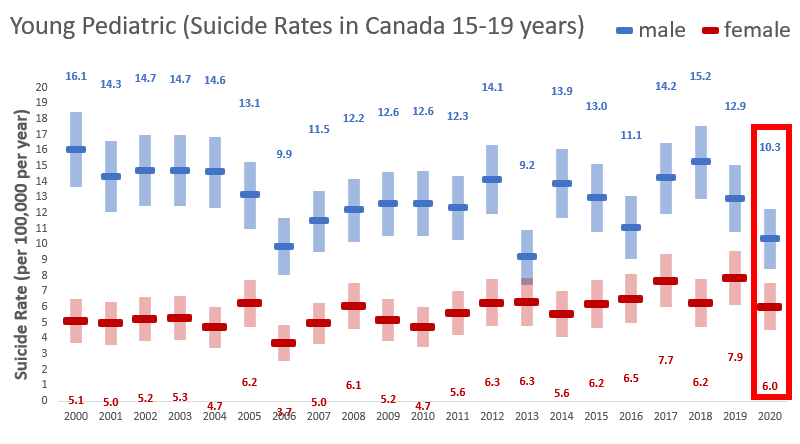
Q: If I presented this graph to claim that "the pandemic, and high school closure reduced suicides in Canadian students," what is the LARGEST error I'd be making?
/1
Two days ago, I posted a quiz:
Q: If I presented this graph to claim that "the pandemic, and high school closure reduced suicides in Canadian students," what is the LARGEST error I'd be making?
/1

Here were the responses and the distribution. I'm going to go by "least right" answers first, and hopefully you can learn about statistical interpretation and youth suicidology at the same time.
Caution: math involved
/2
Caution: math involved
/2

❌C: "The change was within fluctuation seen year to year" - True, but more an error in interpretation...
Each fluctuation could or could not be due to any number of factors, and combining sexes, this WAS the 2nd-3rd largest drop.
/3
Each fluctuation could or could not be due to any number of factors, and combining sexes, this WAS the 2nd-3rd largest drop.
/3

❌A: "the change between 19-20 overlaps error bars" - again, totally true
BUT... this is whole population, so error bars are more there to "warn you" what the likely year-to-year variance is. It's measuring all population, so to say it's decreased is accurate.
/4
BUT... this is whole population, so error bars are more there to "warn you" what the likely year-to-year variance is. It's measuring all population, so to say it's decreased is accurate.
/4
❌B: "the largest drop was seen in 2006, not now, and there's no school closures/pandemic then." Yup, that's another error that was made in the statement.
But of course, two things could be true (something in 2006 and pandemic/high school closures now).
/5
But of course, two things could be true (something in 2006 and pandemic/high school closures now).
/5
✅✅So the right answer: C! ✅✅
"15-19 includes people who have left high school"
Why is this the largest error? because suicide rates increase by each year, in a "normal growth" (exponential increase then decrease in rate change as kids get older)
/6
"15-19 includes people who have left high school"
Why is this the largest error? because suicide rates increase by each year, in a "normal growth" (exponential increase then decrease in rate change as kids get older)
/6

On top of this, the "percent in some form of high school" by each age (estimates based on a number of resources, from a publication I'm working on pending press):
15 - ~99%
16 - ~98%
17 - ~87%
18 - ~28%
19 - ~4%
/7
15 - ~99%
16 - ~98%
17 - ~87%
18 - ~28%
19 - ~4%
/7
So in this graph measuring Canadian suicides 15-19, anywhere between 50-60% of the kids represented are in kids who are NOT IN HIGH SCHOOL to begin with. We get potential confounders in both the suicides AND population.
/8
/8
There are a # of errors also present in statement:
* yearly #, yet pandemic in march
* closure measures variable throughout year
* each prov has different demography
* correlation isn't causation!!!!!!
* continued previous trend from 2018?
* @ryanjblack noted I forgot a comma
/9
* yearly #, yet pandemic in march
* closure measures variable throughout year
* each prov has different demography
* correlation isn't causation!!!!!!
* continued previous trend from 2018?
* @ryanjblack noted I forgot a comma
/9

* Many other confounders occurred in 2020 including unemployment in families, MORE non-suicide deaths in families in Canada, significant economic stimulus, protests due to police violence, ongoing minoritized inequities.
/10
/10
This is why whenever I post graphs like this, I do NOT claim the opposite of what non-expert people say.
/11
/11
The original #urgencyofnormal authors cited data from <19 years, making all the errors above. This is before you include their mis-citation of CDC, and before you include reprehensible nature of the "suicides argument".
I'm glad they removed it after my criticisms.
/12
I'm glad they removed it after my criticisms.
/12
Also note my question was "pandemic + high school closures," as I've detailed in my thread last week, they made the serious error of assuming a separation between pandemic/school closures anyway! No way national data can do that.
/13
/13
There is expert knowledge in suicidology, & even more expert knowledge in child and adolescent suicidology. If speaking about pediatric suicide, you need:
* child & youth mental health experts
* statistical experts
* accurate data
* proper cited evidence
& * suicidologists
/fin
* child & youth mental health experts
* statistical experts
* accurate data
* proper cited evidence
& * suicidologists
/fin
and to be clear, the 50-60% is the proportion IN school, my double negatives confused me. Here's the average for 1999-2020: 

• • •
Missing some Tweet in this thread? You can try to
force a refresh


