Let's talk about breakthrough deaths. It's honestly been a tough couple of days, with everyone yelling at me that I was lying, or worse, turning anti-vax, because I've said 20%-25% of recent COVID deaths are vaccinated. I worried I was way out of line so I checked more numbers.
I'm going to go through what I found in detail. Like, far too much detail. Like, it's going to be a long thread. But first, a few notes.
Okay, so this keeps tripping people up: THE EXISTENCE OF BREAKTHROUGH CASES, EVEN IN LARGE NUMBERS, DOES NOT SHOW THAT VACCINES ARE INEFFECTIVE.
The vaccinated population is much larger and older than unvaccinated population, so it can produce many deaths even if safer overall!
The vaccinated population is much larger and older than unvaccinated population, so it can produce many deaths even if safer overall!
Again, in case anyone was unclear: THE VACCINE MAKES YOU MUCH SAFER AND YOU SHOULD BE VACCINATED AND BOOSTED. Joe Rogan is scum! Ivermectin doesn't do anything! Etc. etc.
So, given that: why bother to figure out the share of deaths that are vaccinated? Because different numbers are useful for different things. And knowing what share of the pandemic's worst harms fall on vaccinated people is essential knowledge for policymakers.
There a couple different ways you can think about COVID harms: 1) Individual risk, and 2) societal burden.
If you want to know the former, you need per-capita death rates. But death rates don't tell you anything about the latter. For that, you need aggregate outcome data.
If you want to know the former, you need per-capita death rates. But death rates don't tell you anything about the latter. For that, you need aggregate outcome data.
Right now, a lot of policymakers and policy thinkers seem to be operating under a very particular assumption: that almost everyone dying of COVID is unvaccinated. If that assumption proves wrong, we need to revisit those policy approaches!
Another technical note: for the purposes of this data, "fully vaccinated" means having received 2 mRNA shots or a J&J shot, regardless of booster status. I'm using that definition because it's what the CDC has used to collect and calculate this data.
You might argue that at this point, "fully vaccinated" means boosted. Maybe so! But if that's the case, we've moved the goalposts, and we live in a society with "full" vaccination rate under 50% and many people uneligible for a third shot.
Okay, with all that aside, what I've done is look for breakthrough data from the CDC and all 50 states.
The topline takeaway is simple: we don't collect nearly enough breakthrough data! The numbers are often delayed, absent, or limited.
The topline takeaway is simple: we don't collect nearly enough breakthrough data! The numbers are often delayed, absent, or limited.
However, there is still a substantial amount of data available - enough to get a ballpark figure for breakthrough deaths and/or hospitalizations, even if knowing an exact nationwide figure is impossible.
The broadest data source is, of course, the CDC. It published a report on breakthrough cases using data from 26 jurisdictions. In that data, breakthrough deaths rise from 20% of all deaths in October to 23% in the first week of December. cdc.gov/mmwr/volumes/7…
After the CDC, there are the states. 23 states report NO breakthrough data I could find - yikes. Another 5 report cumulative figures, which is basically useless.
Another 5 report only death RATES by vaccination status but no raw figures. Contrary to popular belief you can't really reverse-engineer the absolute numbers from those figures because they've been age-adjusted.
That leaves 17 states with breakthrough data that can be used to produce raw numbers or population shares. If you're thinking "Wait, oh my god, is he going to tweet about each of these 17 states?" the answer is "Yes, I am."
What I'm going to share here is the most recent data from a reasonable period from each state, for deaths, or if that's unavailable, hospitalizations. It won't be consistent because the data isn't consistently presented. But I think a pattern will emerge.
Okay, first state: California. It has good data. It has daily death data broken out by vaccination status. From Dec. 10 to Jan. 9 there have been 1366 deaths, 281 vaccinated. That's a share of 20.6%. data.chhs.ca.gov/dataset/covid-…
Connecticut. Weak data here, cumulative death totals (20.8% of deaths between February and November were vaccinated) plus a current hospitalization breakdown. Right now 483 vaccinated people are hospitalized in CT, or 46% of hospitalizations. data.ct.gov/stories/s/q5as…
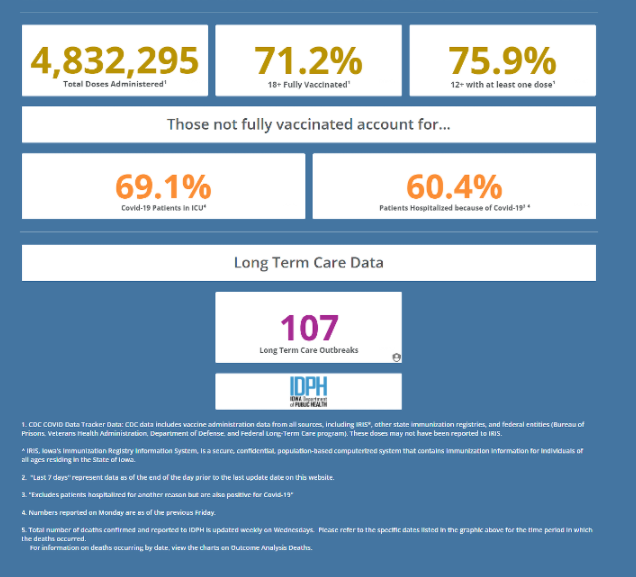
Iowa. Weak data here too. All I can find is this graphic on the dashboard, indicating that 30.9% of current ICU cases and 39.6% of current hospitalizations are vaccinated. coronavirus.iowa.gov 
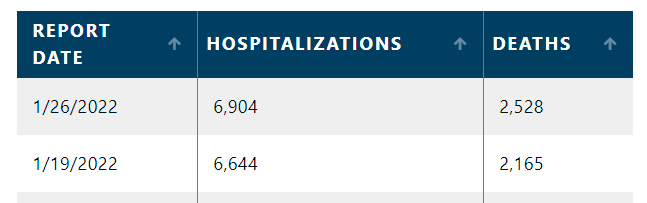
Illinois. There's good breakthrough data here, although it requires some minimal calculating because it's presented cumulatively over time. In the two weeks before Jan. 26, there were 644 vaccinated deaths, about 38% of total. dph.illinois.gov/covid19/vaccin…
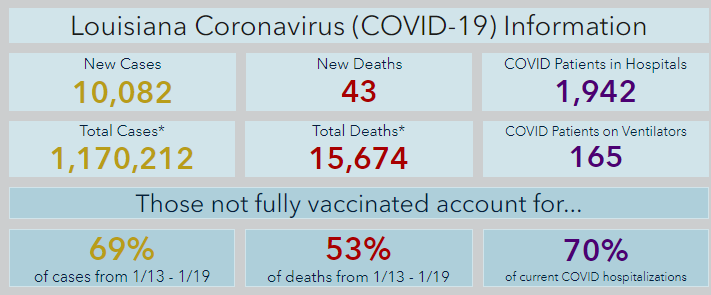
Louisiana. Again, you just have a number on a dashboard, not great. It claims that vaccinated people are 30% of current hospitalizations and 47% of deaths in the third week of January. Frankly I find this figure improbably high, but it's what they report. ldh.la.gov/Coronavirus/
Massachusetts. They put out a weekly breakthrough case report. The most recent one shows 275 vaccinated deaths. That's about 40.8% of the total deaths by my calculation. mass.gov/doc/weekly-rep…
Minnesota. Unsurprisingly, the state puts out excellent weekly breakthrough data. Less good, it ends on Dec. 26. For the month of December, it reports 622 deaths, of which 178, or 27.8%, are vaccinated. health.state.mn.us/diseases/coron…
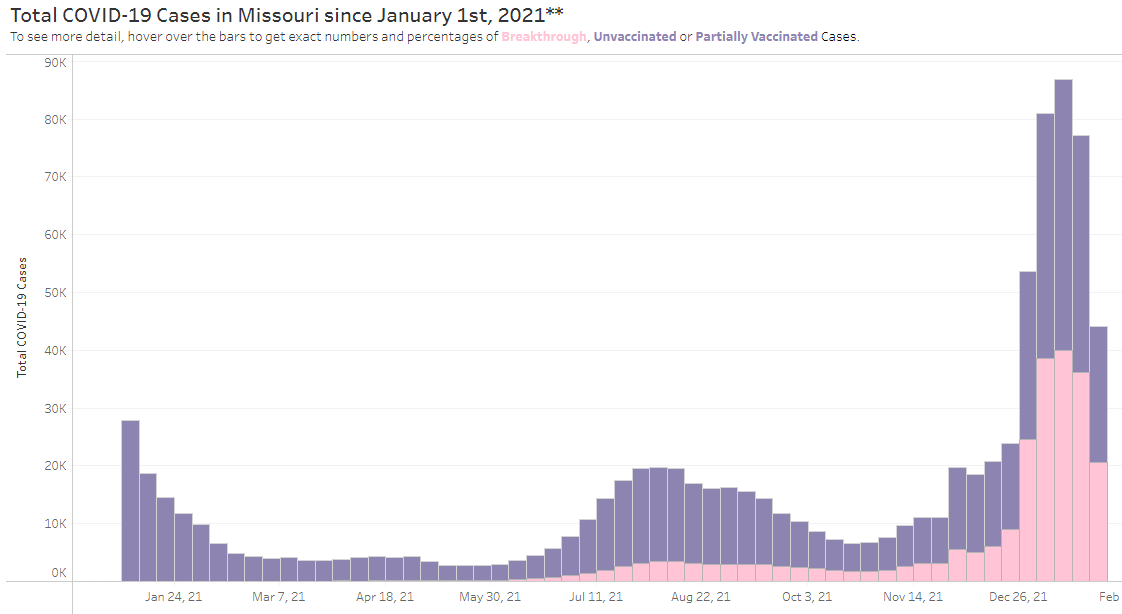
Missouri. It only puts out periodic data on breakthrough CASES, which are 46% of all cases in the last few weeks. Honestly, I wouldn't attach a lot of meaning to these figures. C for effort. health.mo.gov/living/healthc…
North Dakota. It has, uh, whatever this is. It tracks active hospitalizations by vaccination status. I think you have to just eyeball it, basically. It suggests a roughly 2-to-1 unvaccinated-to-vaccinated ratio, but really, who knows. health.nd.gov/diseases-condi…

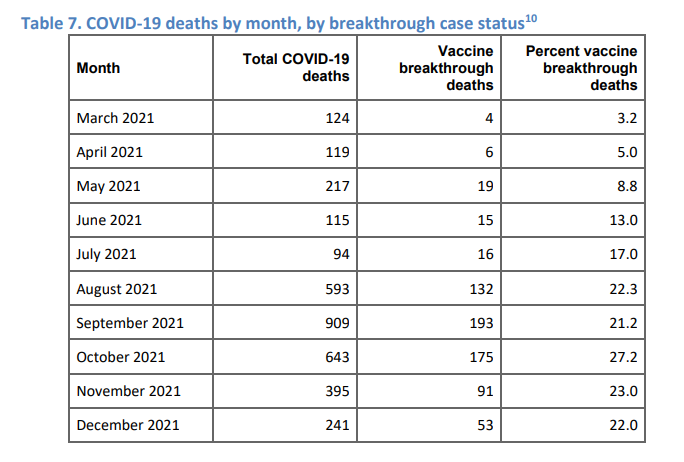
Oregon. It publishes a report with breakthrough deaths broken out by month, ending in December. In December, they constituted 22% of all deaths. oregon.gov/oha/covid19/Do…
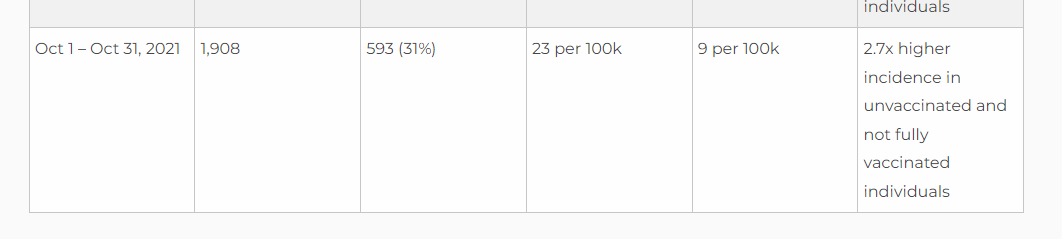
Pennsylvania. The state publishes a fairly messy report on breakthrough cases, hospitalizations, and deaths. The deaths data is further behind. It shows that 25% of hospitalizations in December were vaccinated, and 31% of deaths in October were vaccinated. health.pa.gov/topics/disease…
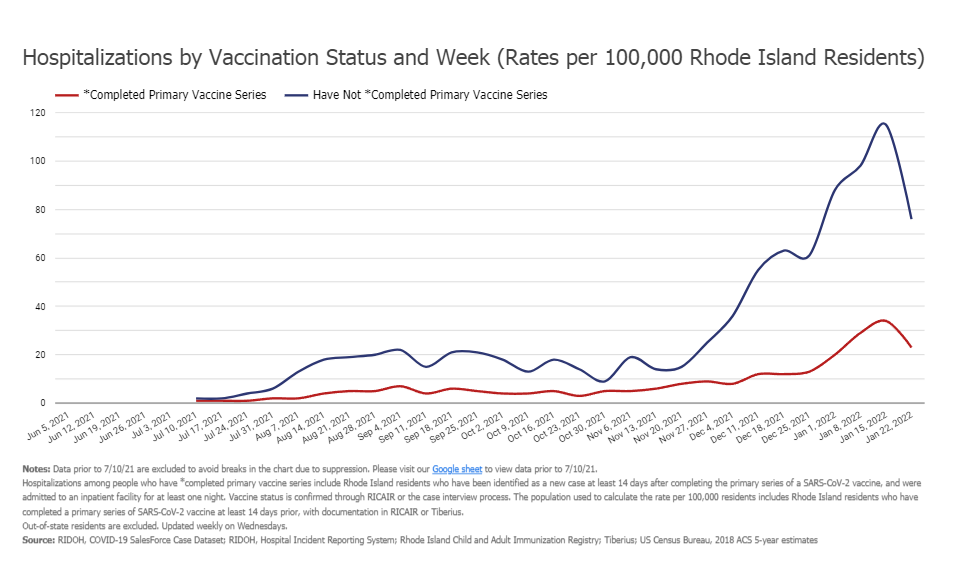
Rhode Island. The state publishes a chart of hospitalizations by vaccination status from which you can actually extract raw numbers. 22.9% of January hospitalizations are vaccinated. …through-cases-rihealth.hub.arcgis.com
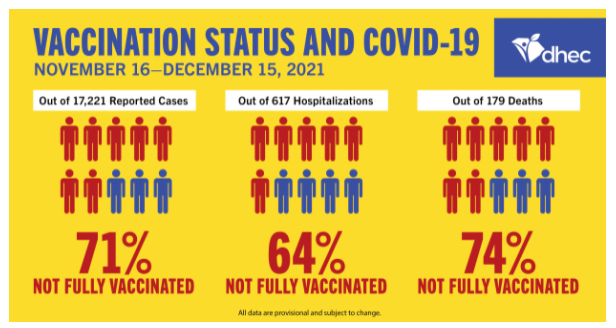
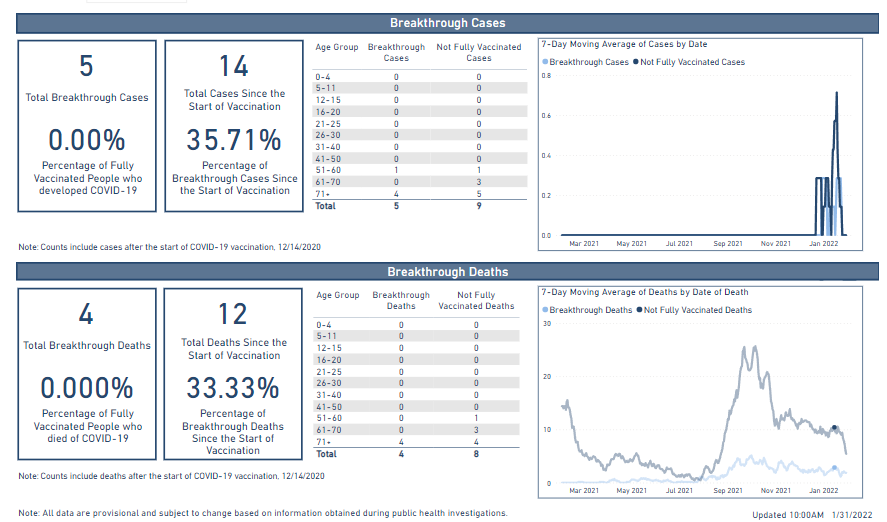
South Carolina. The only non-cumulative breakthrough data are periodically updated infographics, the most recent covering Nov. 16 through Dec. 15. In that period, 26% of deaths were vaccinated. scdhec.gov/covid19/covid-…
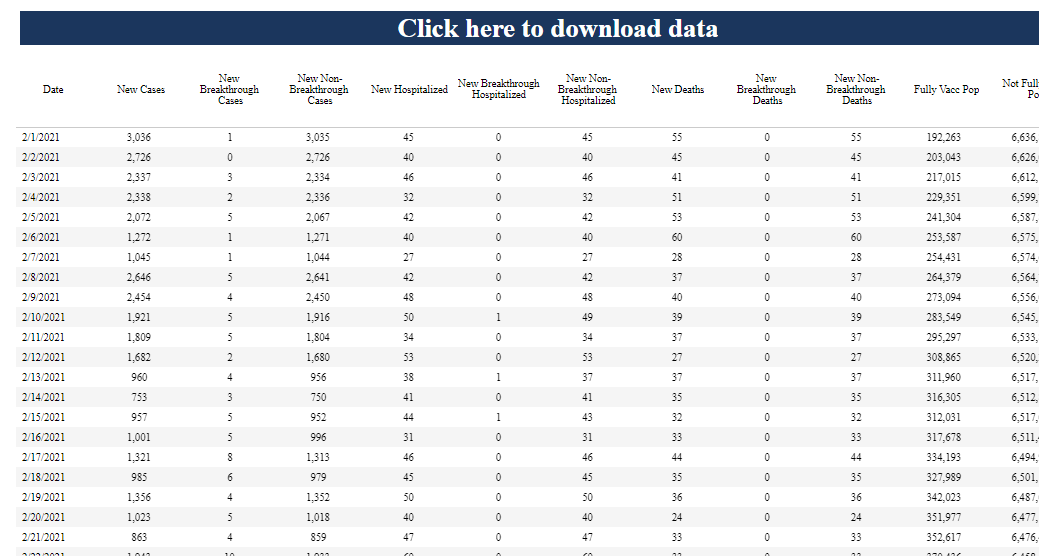
Tennessee. It might have the best breakthrough data in the country, with detailed, downloadable spreadsheets with daily numbers. Really exceptional. It shows 802 deaths between Jan. 1 and Jan. 22, of which 178, or 22.1%, are vaccinated. tn.gov/health/cedep/n…
West Virginia. The data dashboard has a strange moving 7-day average of death numbers by vaccination status. This looks like a rate but isn't one, so we're counting it. On Jan. 15, vaccinated deaths accounted for 21.5% of the overall total. dhhr.wv.gov/COVID-19/Pages…
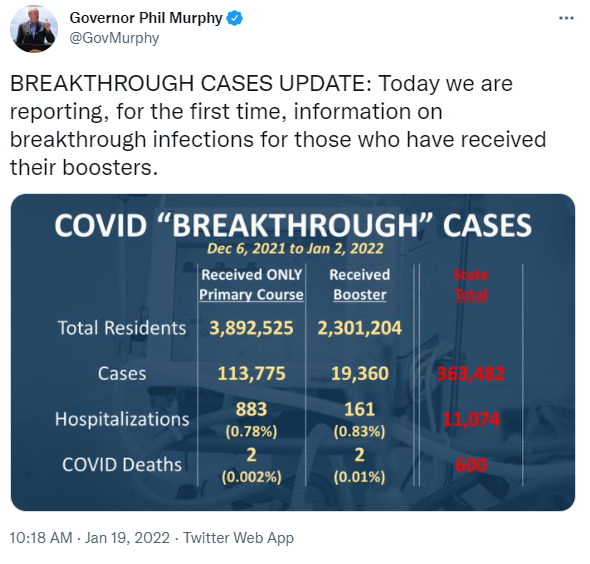
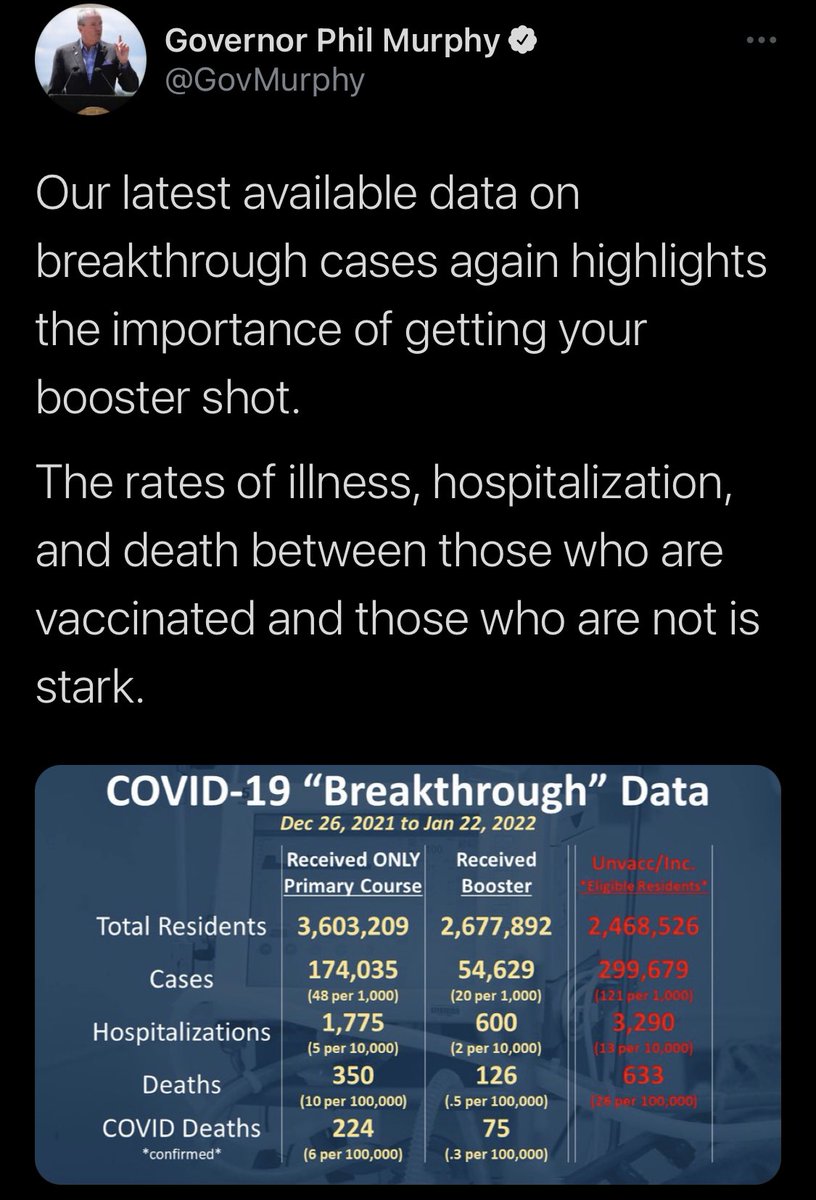
I've held New Jersey for last. There's no data on the state site, but the governor tweeted out figures a few weeks ago. They imply that vaccinated people made up .7% of NJ COVID deaths in December. It's an extreme outlier and I am VERY skeptical. But for completeness, here it is.
A few takeaways from this:
We need better data on breakthrough COVID! Right now, we are flying blind to a significant extent. As long as these cases remain relatively invisible, it's easier for politicians to build policy around the myth that COVID only harms the unvaccinated.
We need better data on breakthrough COVID! Right now, we are flying blind to a significant extent. As long as these cases remain relatively invisible, it's easier for politicians to build policy around the myth that COVID only harms the unvaccinated.
It's probably impossible, using current data, to calculate the exact share of COVID deaths and hospitalizations that are vaccinated nationwide. But it's not small, almost certainly over 20%. Anyone telling you that 99 out of 100 deaths are unvaccinated is misinformed, period.
And finally, again, none of this means the vaccines don't work. They do. Vaccines are clearly our first-line defense against COVID. But this data suggests that, absent more aggressive measures, currently vaccinated people will nonetheless suffer many more thousands of deaths.
Update: looks like it was right to be skeptical of the NJ data. In the newest figures the share of breakthrough deaths jumps from .7% to 32%. Clearly a data entry error of some kind.

• • •
Missing some Tweet in this thread? You can try to
force a refresh