
2021-2022 Economic Survey (ES) uses remote sensing and #geospatial data ‘to track, compare
and represent longer term developments’. But when using remote sensing data, proper calibration, validation and visualisation are necessary. Else the data can be very misleading. 🧵
1/13
and represent longer term developments’. But when using remote sensing data, proper calibration, validation and visualisation are necessary. Else the data can be very misleading. 🧵
1/13
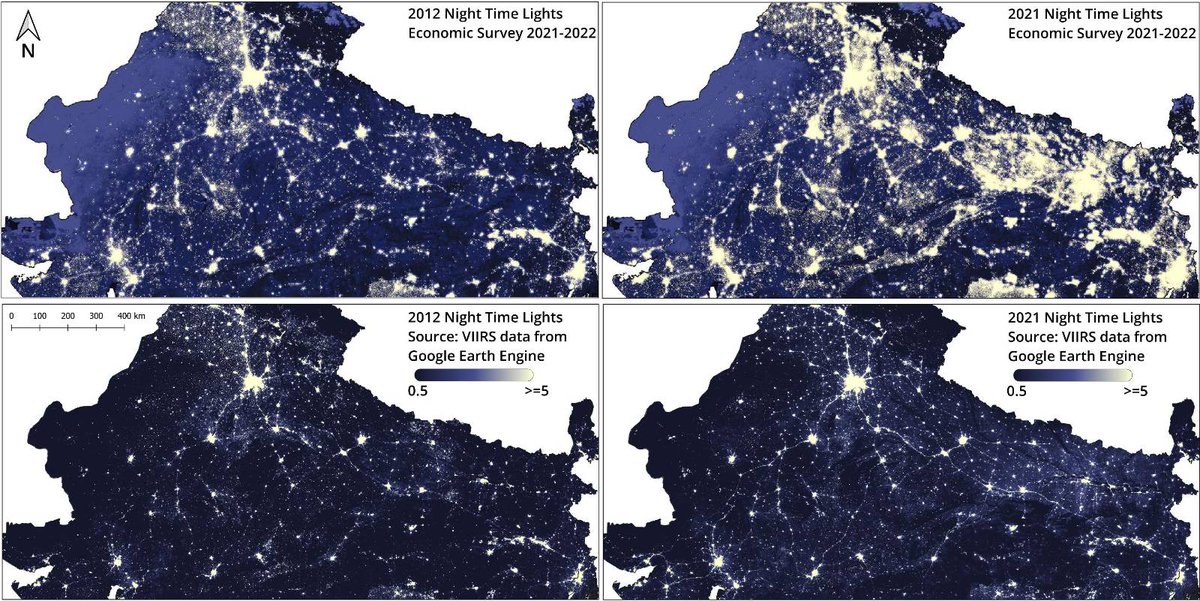
ES states that comparison of night time lights (NTL) between 2012 and 2021 provides “..an interesting representation of the expansion of electricity supply..” apart from distribution of population, economic activity and ribbon developments.
2/13
2/13
But do the maps make sense? More than representing expansion of electricity, the maps represent the challenges of visualising satellite data. NTL data contains radiance values. The min and max radiance values used for visualisation can dramatically change the interpretation.
3/13
3/13
This image compares the NTL growth presented in the Indian economic survey (ES) 2021-22 with NASA NTL data available on Google Earth Engine visualised with different min-max combinations.
4/13
4/13

The ES NTL map appears to have been made with a min-max range of 1 - 1.5. Although we cannot be certain since we only have the pdf image and not the higher resolution image.
5/13
5/13
Reducing the max value makes less bright areas appear brighter. But which of this is a reasonable representation? Since presumably buildings/ settlements which have electricity supply is what we are interested in, built-up (BU) maps should provide an indication.
6/13
6/13
Comparing the BU map (WorldCover by @esa) with NTL for the UP-Bihar region, the 0.5 to 5 min-max combination appears to align better with the BU map and is diff. from ES NTL map. But what min-max combination is useful is also dependent on the extent and scale that is visualised.

The 0.5 to 5 (bottom row) that aligned well with the BU map in the previous image seems to show significantly less change in NTL than ES. This could be an artefact of the larger extent which is now being visualised within a small image. Hence I tried middle row (0.5 to 3 range).

This may be a more reasonable representation when looking at a large region. But both the two images above clearly show that the ES maps (top row) are, in comparison, not accurate. For them to be accurate, parts of Bihar would have to be built-up and illuminated similar to Delhi.
Similarly, NTL in the southern part of India appears to have changed quite a lot in ES maps (row 1) as compared to maps in rows 2 and 3 (displayed with different min-max combinations).
10/13
10/13

Given the challenges of visualisation, rather than drawing inferences from a couple of maps, we need better quantitative analysis of well calibrated time series data + validation with ground truth data to assess expansion of electricity or other economic activity.
11/13
11/13
But the calibration of time series NTL data is still a work in progress. Hence inferences from NTL data should be treated with caution. See the following links for more information on recent work around calibration and validation of NTL data.
12/13
12/13
mdpi.com/2072-4292/13/5…
mdpi.com/2072-4292/13/6…
Note that the datasets mentioned in above papers are not available for 2012 or for 2021 as of now.
13/13
mdpi.com/2072-4292/13/6…
Note that the datasets mentioned in above papers are not available for 2012 or for 2021 as of now.
13/13
• • •
Missing some Tweet in this thread? You can try to
force a refresh


