
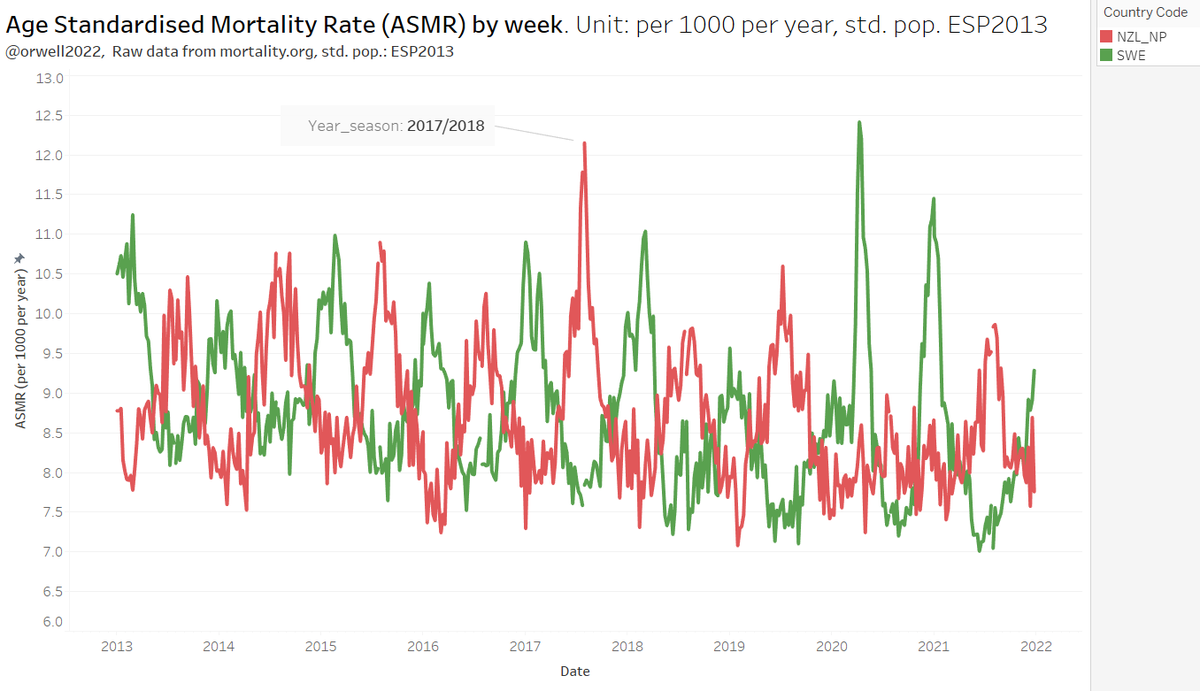
1/ Let's do another ASMR match race:
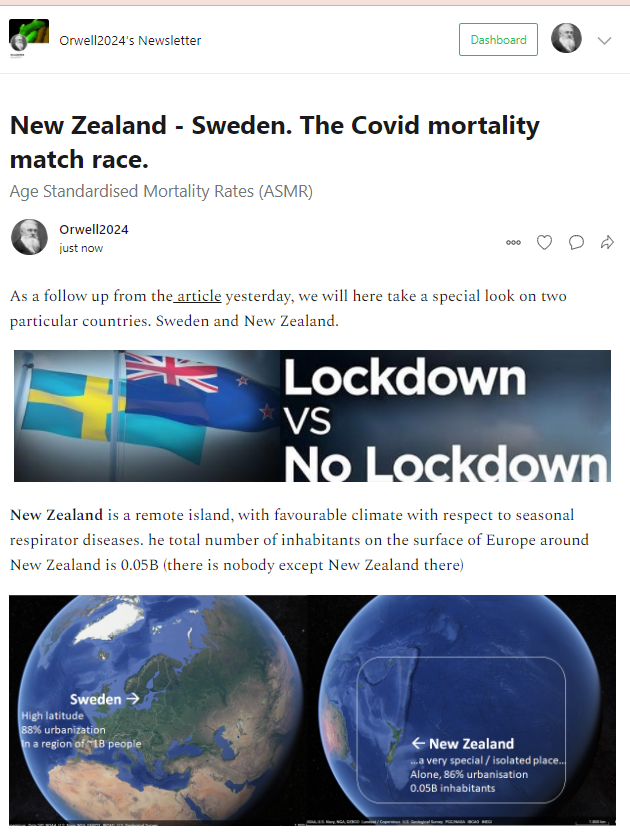
🇳🇿New Zealand - 🇸🇪Sweden.
Those have very different locations (mild versus hostile climate) and are shifted in seasonality by 6 months.
Respiratory diseases follow seasons. They always have, despite the denial by @c_drosten et. co.
🇳🇿New Zealand - 🇸🇪Sweden.
Those have very different locations (mild versus hostile climate) and are shifted in seasonality by 6 months.
Respiratory diseases follow seasons. They always have, despite the denial by @c_drosten et. co.
https://twitter.com/orwell2022/status/1488844309407358979
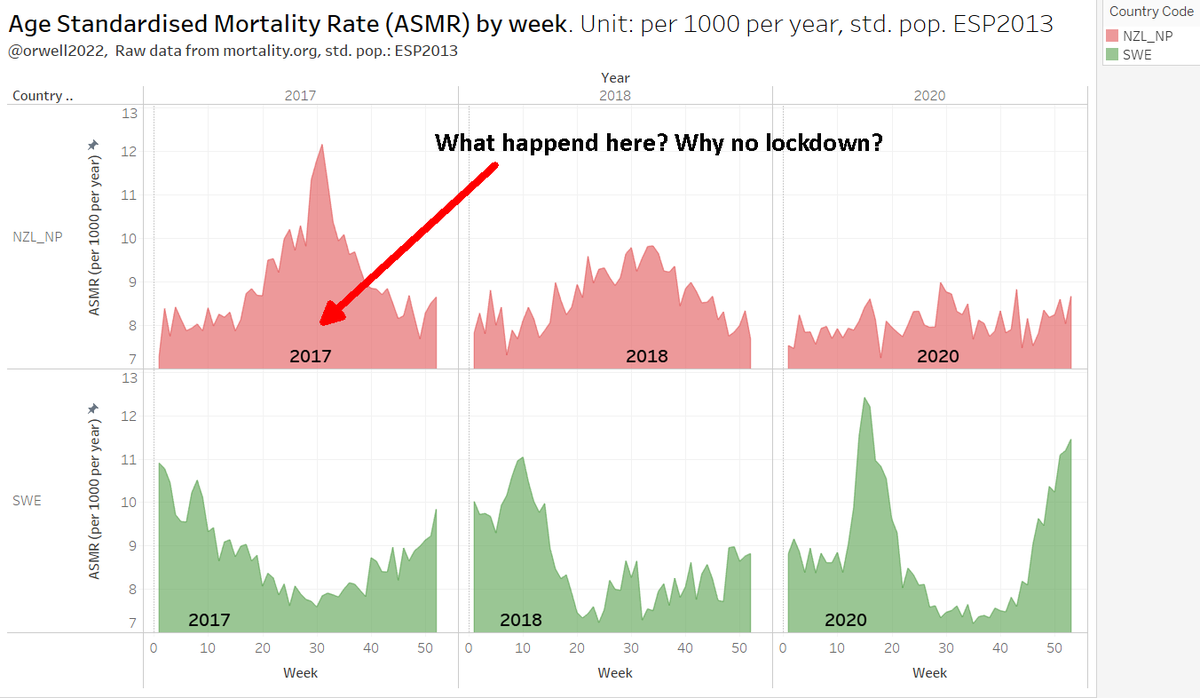
2/ The seasonality becomes even clearer when showing this by calendar weeks.
The inclination of the earth makes this happen: Seasons.
Season modulate UV light exposure, temperature and humidity. Those drive respiratory diseases. Main parameter: UV.
The inclination of the earth makes this happen: Seasons.
Season modulate UV light exposure, temperature and humidity. Those drive respiratory diseases. Main parameter: UV.
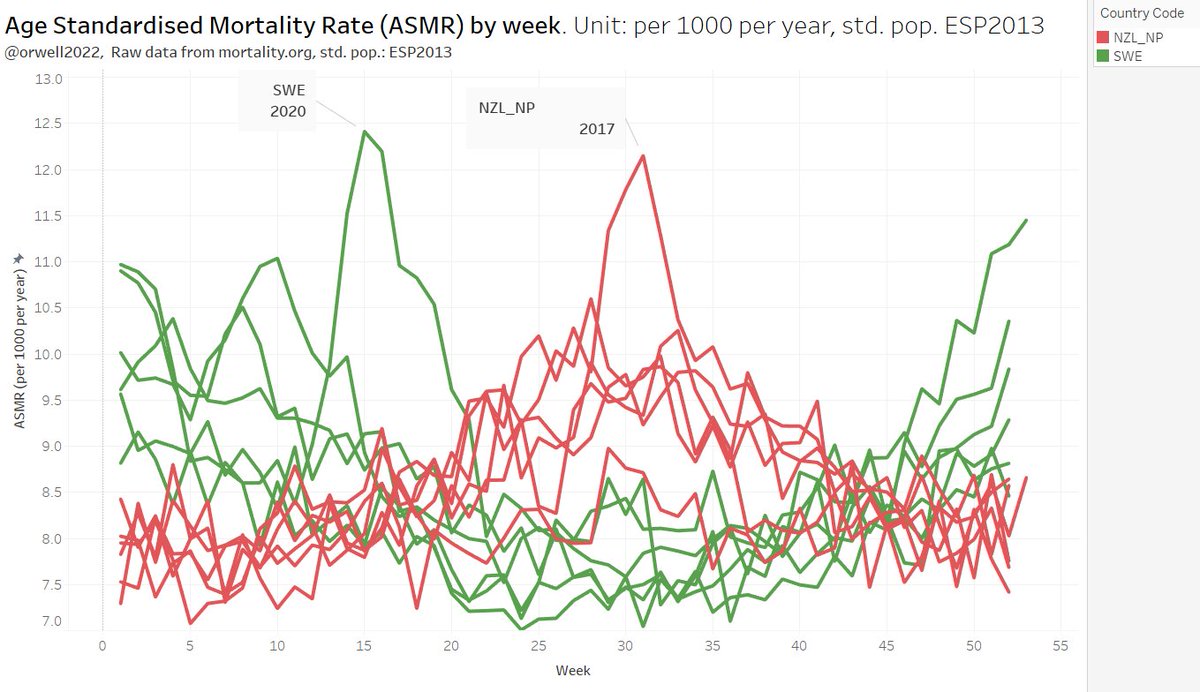
3/ Notice the heavy seasons 2017 in New Zealand.
Why was there no general panic? Does the NZ Covid response appear rational when comparing with Sweden in 2020?
No. But we know this.
Why was there no general panic? Does the NZ Covid response appear rational when comparing with Sweden in 2020?
No. But we know this.

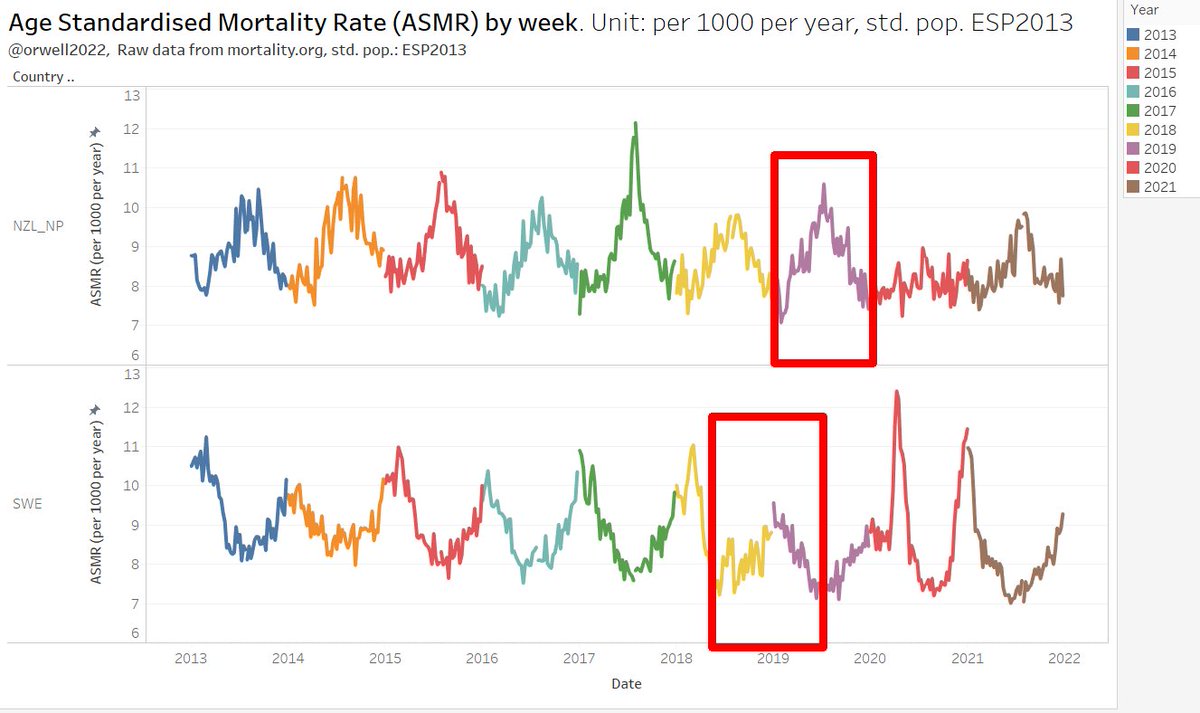
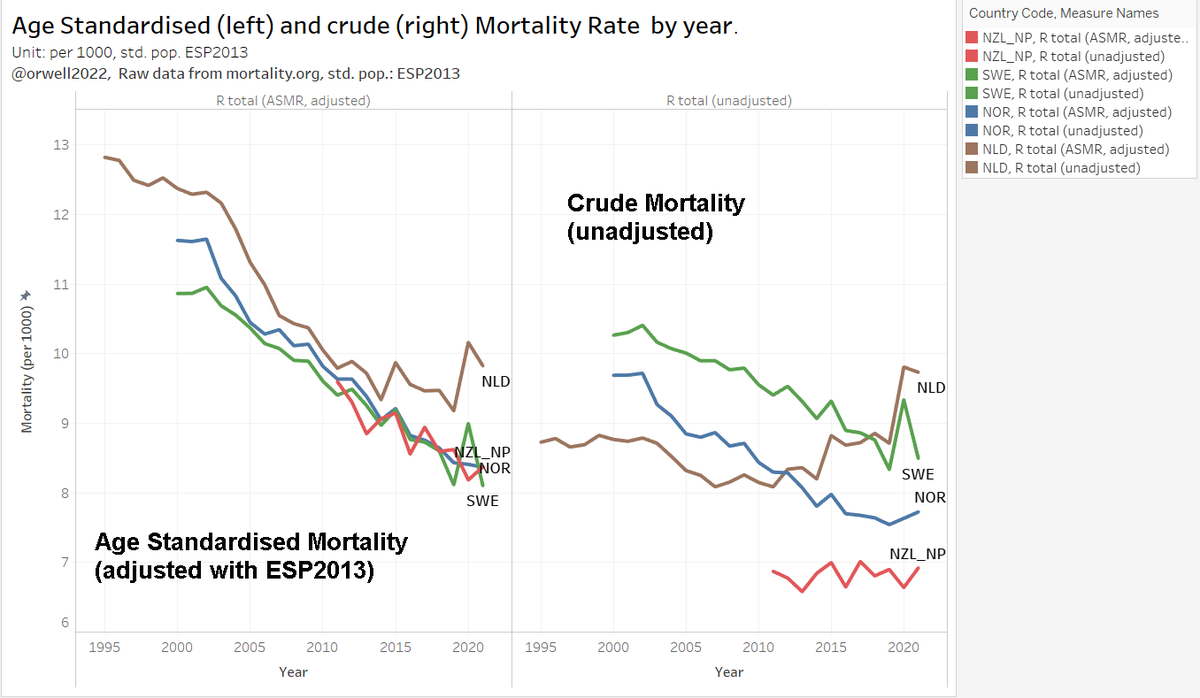
4/ This is how the yearly ASMR trend looks like.
For new Zealand, the calendar year is also the natural flu season year. For Sweden, we would need to shift the date by 6 months. We will do that, but first here the calendar comparison.
For new Zealand, the calendar year is also the natural flu season year. For Sweden, we would need to shift the date by 6 months. We will do that, but first here the calendar comparison.

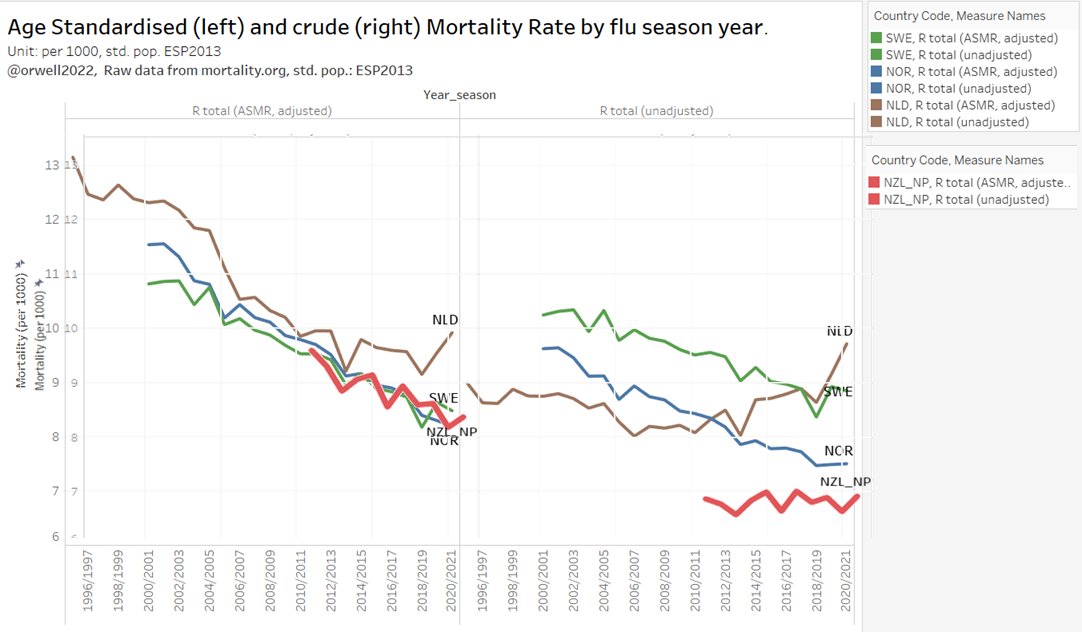
5/ For new Zealand, the calendar year is the natural flu season year. For Sweden, we would need to shift the date by + or - 6 months. Backward is likely better, as diseases will start in the northern hemisphere. NZ will probably lag in every season (they get it last).
6/ So comparing north and south hemisphere gets a bit tricky when using date aggregation. But some classic MGMT style PowerPoint engineering (and transparent colours) works wonders here. PPT is the main MS product, that I really like.😅
SWE is green, NZ red here.
SWE is green, NZ red here.
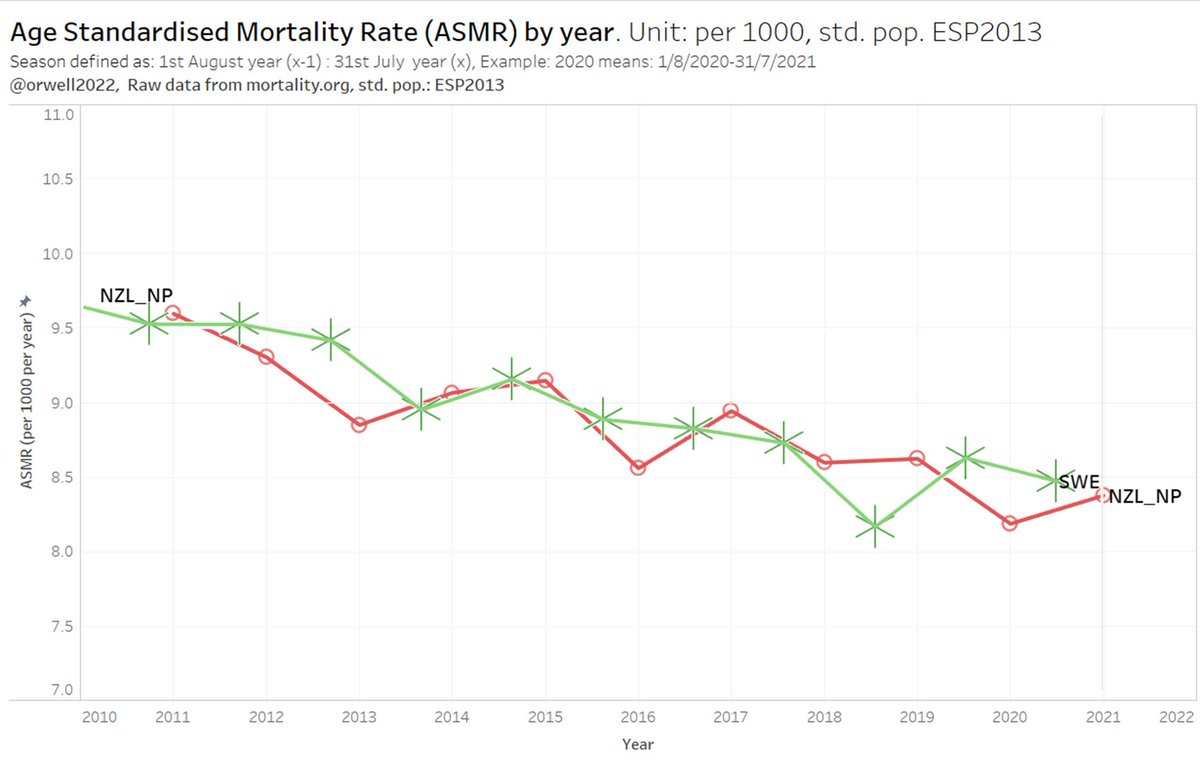
7/ Summary: It doesn't make any sense what NZ is doing. The direct comparison with Sweden, a country located in a challenging climate with respect to seasonal diseases, shows this clearly.
NZ: stop the absurd Covid response.
NZ: stop the absurd Covid response.
8/ Find here the extended substack version which includes some words about the record flu season 2017 in NZ.
orwell2024.substack.com/p/new-zealand-…
orwell2024.substack.com/p/new-zealand-…
9/ Update - added a demo to show the effect of ASMR versus crude mortality. It's in particularly visible for NZ.
On the left we see the ASMR (Age Standardised Mortality) and on the right the crude mortality as taken from source (mortality.org).
On the left we see the ASMR (Age Standardised Mortality) and on the right the crude mortality as taken from source (mortality.org).
10/ We can do this by season after applying some classic PPT overlay engineering and the use of transparent ink.
The substack articles have been updated as well.
The substack articles have been updated as well.
• • •
Missing some Tweet in this thread? You can try to
force a refresh


