Scottish Unity - Edinburgh Group Profile picture
Feb 3, 2022 6 tweets 3 min read Read on X
Public Health Scotland - covid data
Booster proportion continues to rise rapidly - a higher proportion of cases, hospital admissions and ‘covid deaths’ than the proportion of the population
Maybe #TheDrugsDontWork ?
“But we have to look at population"
Okay, same data by rate. Compared to unvacinated, booster is
- 30% more likely to ‘catch covid’ (test positive)
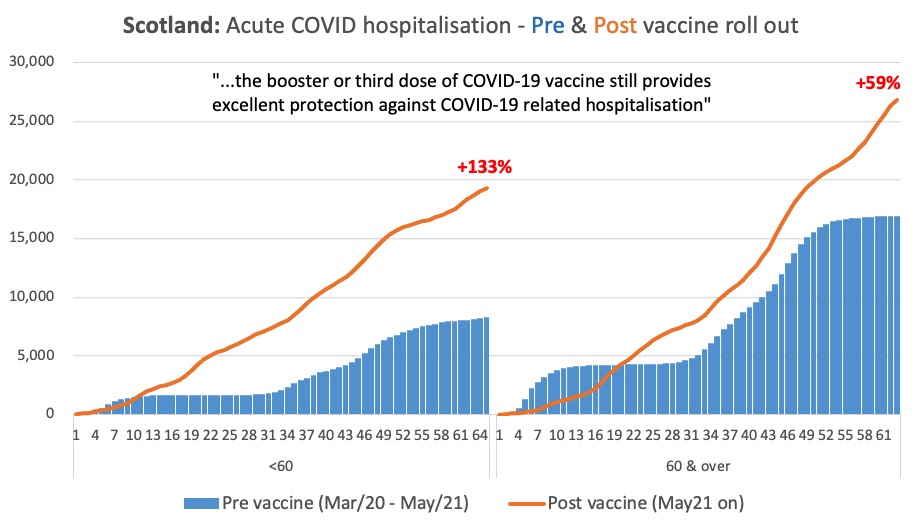
- 20% less likely to be hospitalised
- but 70% more likely to be a covid death
“But we have to consider different ages!"
Okay, age-standardised. Firstly, case risk. These are 95% confidence ranges, so the correct answer is ‘probably’ in the shaded range.
Both boosted and two-dose are more likely to catch covid (test positive) than unvaccinated. 🤔
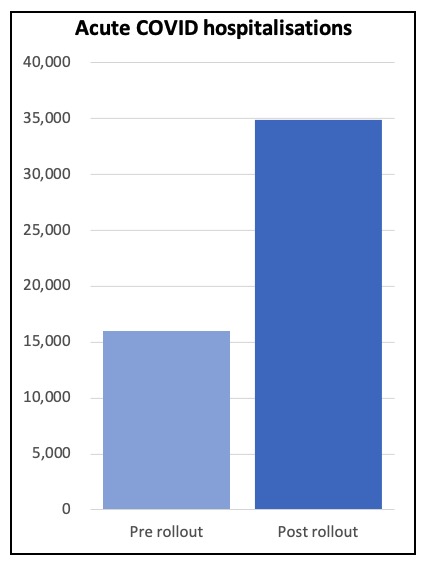
These are the hospitalisation rates.
Here we see where counting Boosted as ‘Two dose’ pushes any resulting hospitalisations into the two-dose category. Where that was previously low and stable, risk suddenly shows rocketing up.
‘Bayesian Datacrime'
boriquagato.substack.com/p/new-data-on-…
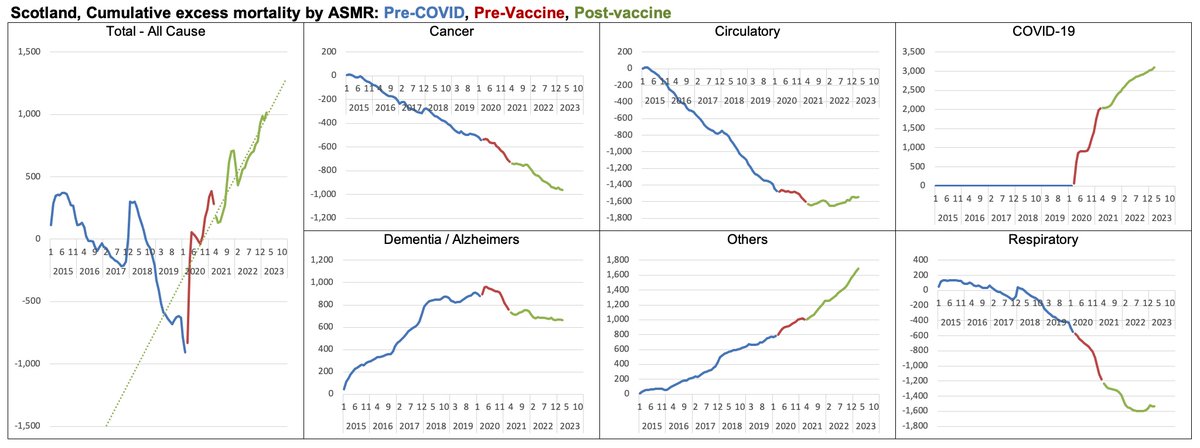
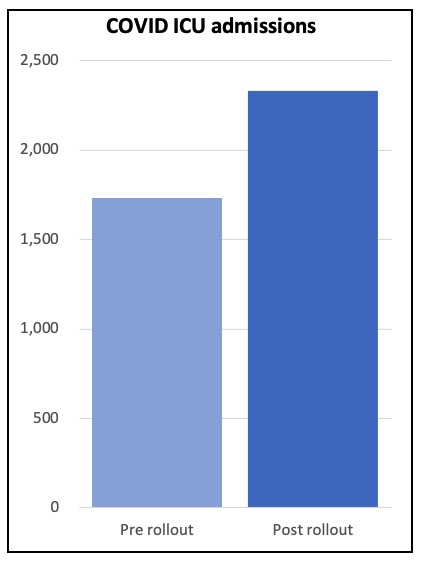
Finally mortality rates by ASMR. Same problem, the activity of ‘Boosting’ appears to be creating problems, which are counted into the two-dose and disrupting the risk. Two dose showing probably worse than unvaccinated
‘Bayesian Datacrime'
boriquagato.substack.com/p/new-data-on-…
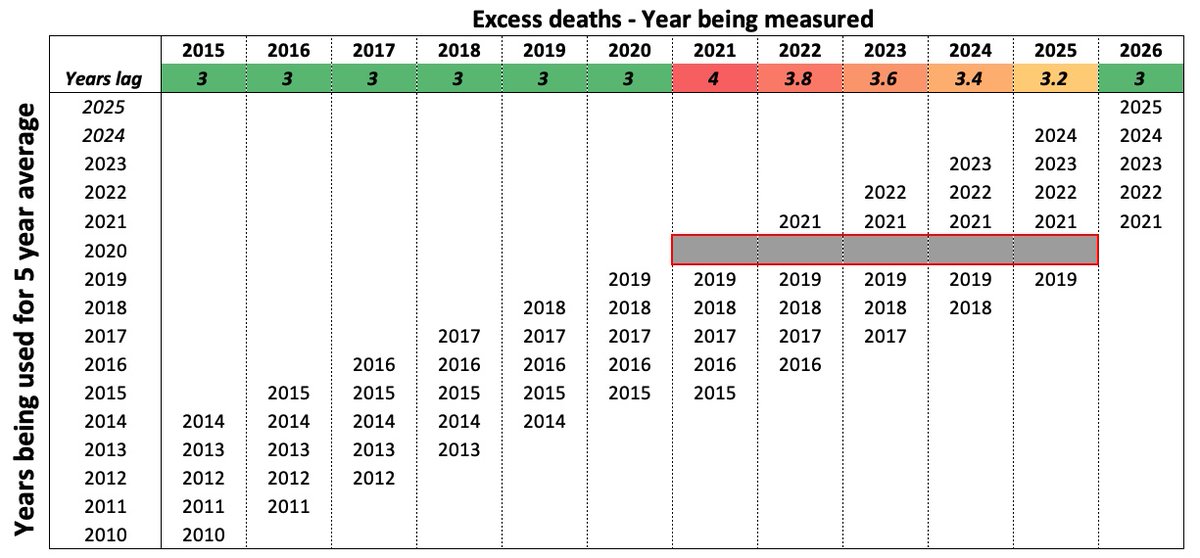
Over time these data will settle. Boosters no longer contaminate two-dose data, Booster range will settle and look like… whoop, ‘waning protection’! Another dose needed!
Rinse & repeat.
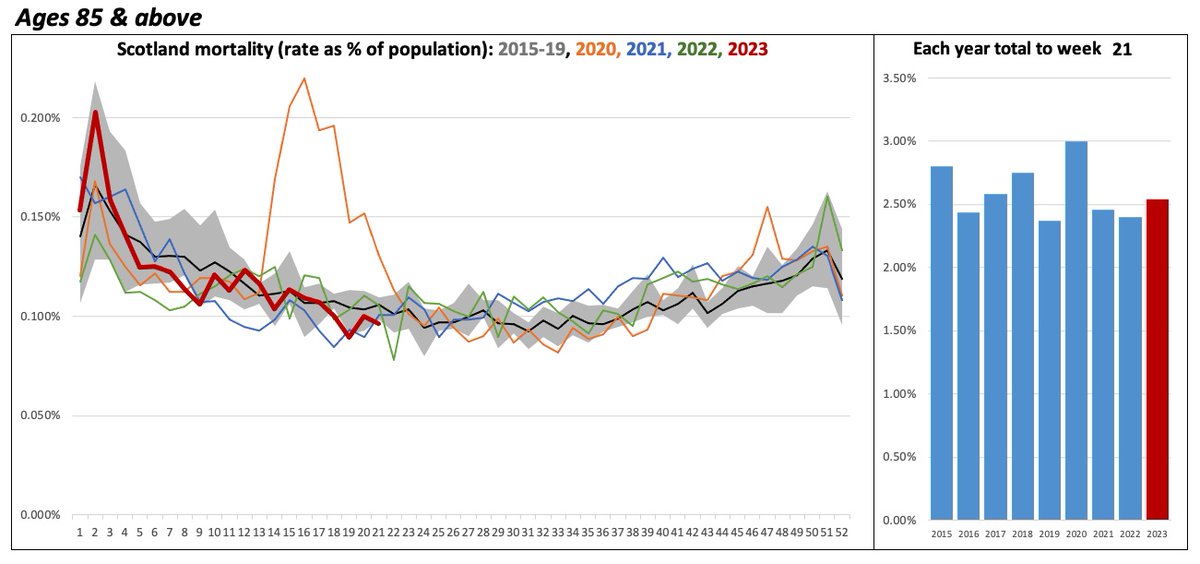
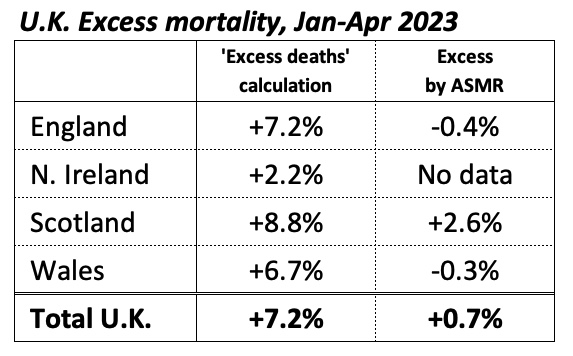
Or see that all-cause is back below normal (after autumn spike), and this was over months ago

• • •

Missing some Tweet in this thread? You can try to force a refresh
 

Keep Current with Scottish Unity - Edinburgh Group

Scottish Unity - Edinburgh Group Profile picture

Stay in touch and get notified when new unrolls are available from this author!

Read all threads

This Thread may be Removed Anytime!

PDF

Twitter may remove this content at anytime! Save it as PDF for later use!

Try unrolling a thread yourself!

how to unroll video
  1. Follow @ThreadReaderApp to mention us!

  2. From a Twitter thread mention us with a keyword "unroll"
@threadreaderapp unroll

Practice here first or read more on our help page!

More from @scojw

Jun 3, 2023
Accounting for demographic changes (increased number of elderly, higher average age in each group), Scotland’s mortality in 2023 looks much as we would expect.
Started with a high January (“flu”) than affected older age groups, and now coming down.
85+ quite a normal year Image
Ages 75-84 were most hit by flu, beyond even the high of 2018. Thus showing as a high year initially, then below average but since has been running the high end of normal range.
A bit elevated, but not especially so. Image
Ages 65 to 74.
It’s too tricky to calculate the average age in this group (we don’t have death data by individual year), but suspect the average age is going up, hence the trend here has been gently up since 2015. That said this is a slightly high year, driven by January. Image
Read 7 tweets
May 30, 2023
Scotland excess mortality through April 2023
Accounting for population size & age by use of ASMR, excess mortality in Scotland is +2.6% year-to-date, a bit lower than 2021, a bit higher than 2022.
What’s more thought provoking is when we step back from numbers to see the trends. Image
First, by cause.
Mortality was falling in Scotland, but note that abruptly changed with the pandemic & NO recovery since. The angle of increase hasn't slowed
Cancer trend remains improving, circulatory much worse than it was. Dem/Alz looks like misattribution, & C19 cured flu🙄 Image
This is perhaps clearer when we zoom out and see longer term.
See how much mortality was improving, & that has radically changed. Gov are still attributing basically all excess to COVID + Others.
So what did the miracle 💉achieve if excess is unchanged, and C19 is the excess? Image
Read 5 tweets
May 29, 2023
All UK nations updated their monthly excess mortality through April. For 2023 to date we see;
1) Scotland (+2.6%)
2) Wales (-0.3%)
3) England (-0.4%)
No ASMR data for N.I.
Overall UK total: +0.7%
‘Excess deaths’ shows hugely different, much higher. Why? Image
The chart shows monthly excess by ‘excess deaths’ and by ‘ASMR”. We see ‘excess deaths has ALWAYS measured higher than ASMR - this is not new.
The reason is that ASMR measures against the CURRENT population, and ‘excess deaths’ measures against the population 3 years ago. Image
What IS new is that we are now measuring ‘excess deaths’ against a population not THREE years ago, but almost four years ago.
This is entirely new, and makes ‘excess deaths' even higher. It’s caused by 2020 being dropped from the calculation
This will come back to normal in 2026. Image
Read 6 tweets
Oct 17, 2022
"Beep, beep, beep..."
That's the sound of the reversing alarm, as the narrative is thrown into reverse - "They were never described as preventing transmission". (Actually they were, yet clearly they didn't - as we see from 'cases' data (PCR+) in Scotland. 👇 ImageImage
"But still, robust protection against hospitalisation..."
Er..... in that case Scotland's actual experience on COVID hospitalisations are impossible to explain.
🤔 Image
"Severe cases reduced then....?"
Well, erm, no...., our ICU admissions data demonstrate otherwise.👇 Image
Read 5 tweets
Aug 3, 2022
We've now had equal periods without vaccines (Mar20 until rollout complete in May21) and without vaccines (May21 until now), 63 weeks of each.
We see that despite assurances, ‘acute COVID hospitalisations’ post #sacredcows are 59% higher in the 60+, and 133% higher in under 60s
What we see is;
- More people hospitalised, both <60 (19,000 versus 8,000) and in the'vulnerable' 60 and above (27,000 versus 17,000)
- NO more 'flat' periods where there are no admissions, the rate of admissions is faster than before, and incessant, no breaks
So too ICU - PHS now note "If people test COVID-19 positive on admission to hospital, it may not be the primary reason for admission, and instead an incidental finding"
No 💩 Sherlock, been saying that forever. Look at winter 2020 - 50% of ICU was “Non-COVID19 clinical diagnosis"
Read 5 tweets
Jul 6, 2022
Scotland hospital status updated.
1. Do you need an op?
Upper endoscopy waitlist slightly down, but all other endoscopy waiting lists sharply up, and all imaging waitlists (e.g. CT, MRI) hugely up - ultrasound waitlist nearly doubled. Image
2. You need an op - how is the waitlist?
Chart shows number on the waiting list, and how long they have been waiting. Total continually rising, as well as the proportion waiting 6 months, 12 months, or longer. Image
3. How are we tackling that list?
This shows the number of operations carried out, in total and by month.
The number has been basically steady since early 2021, not recovering toward prior levels. Running around 33% lower than the pre-COVID levels. Image
Read 4 tweets

Did Thread Reader help you today?

Support us! We are indie developers!


This site is made by just two indie developers on a laptop doing marketing, support and development! Read more about the story.

Become a Premium Member ($3/month or $30/year) and get exclusive features!

Become Premium

Don't want to be a Premium member but still want to support us?

Make a small donation by buying us coffee ($5) or help with server cost ($10)

Donate via Paypal

Or Donate anonymously using crypto!

Ethereum

0xfe58350B80634f60Fa6Dc149a72b4DFbc17D341E copy

Bitcoin

3ATGMxNzCUFzxpMCHL5sWSt4DVtS8UqXpi copy

Thank you for your support!

Follow Us!

:(