Ilkka Rauvola Profile picture
Feb 3, 2022 20 tweets 6 min read Read on X
Suomen epidemia 3.2.2022: tilastokeskuksen julkaisemista tiedoista laskettu ylikuolleisuus on melkein kaksi kertaa niin suuri kuin THL:n ilmoittama kuolemien määrä.
1/x
Miten yllä oleva kuva on saatu:
1) otettu epidemiaa edeltävän viiden viimeisen vuoden kuolemat tilastokeskuksen datasta
2/x
Seuraavaksi on laskettu kuukausittaiset kuolemat vuosilta 2015-2019 ja laskettu siitä keskiarvot.
3/x
Tuloksena on tämä kuva.
4/x
Sen jälkeen lisätään toteutuneet kuolemat vuodesta 2015 lähtien.
5/x
Tässä lopputulos, mikäli vertailukohtana käytetään vuosien 2015-2019 keskiarvoa. Our World in Datan estimaatti (ruskea viiva) on selvästi suurempi kuin tämä laskelma (harmaa viiva).
6/x
Myös The Economistin estimaatti on selvästi tätä arviota korkeammalla tasolla: (83...120) x 55.4 = 4600-6600 henkeä.
7/x

economist.com/graphic-detail…
Yllä oleva arvio (kuva 1) on laskettu käyttäen 2015-2019 keskiarvoa (harmaa viiva). Voidaan myös käyttää esimerkiksi 2016-2019 trendiä (keltainen viiva) tai 2004-2019 trendiä (punainen viiva). Ylikuolleisuus on merkittävä riippumatta siitä, millä tavalla lasketaan.
8/x
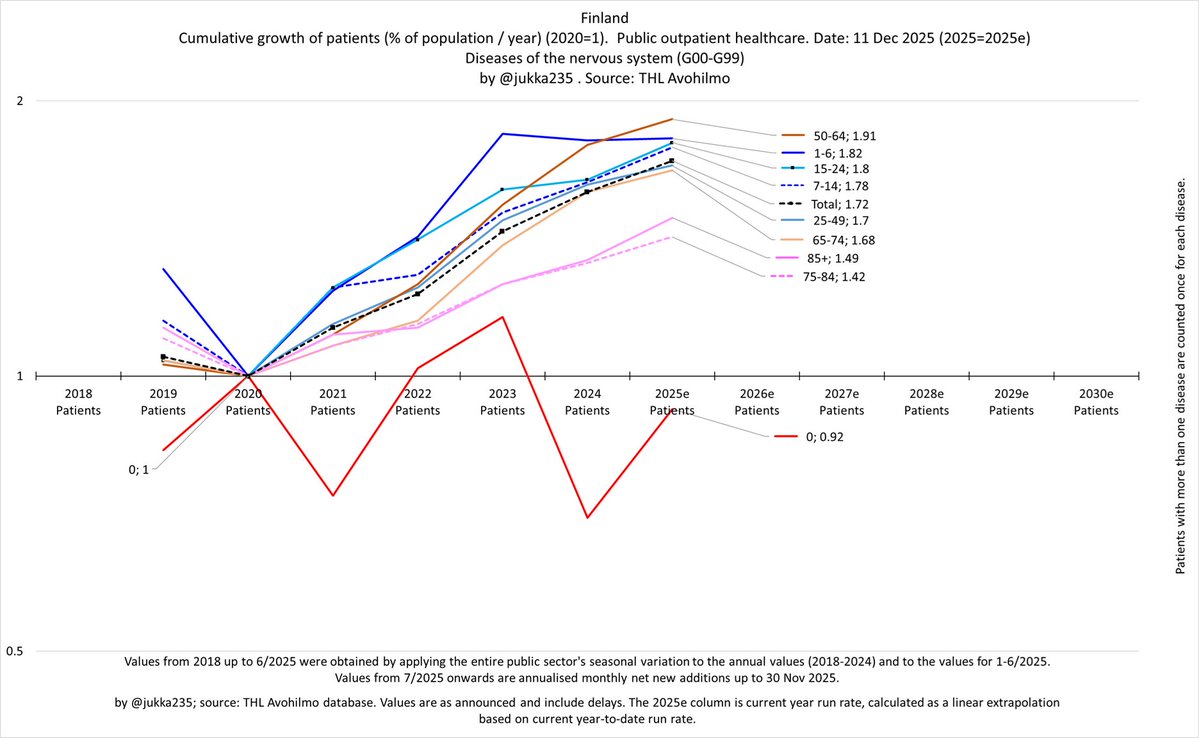
Lasten epämuodostumista johtuvien lääkärikäyntien määrä on noin 3.4-kertaistunut vuoden 2022 alusta lähtien. Tässä on oletettu, ettei kausivaihtelua ole.
9/x
Tässä sama suomenkielisillä koodeilla. Tämä saattaa liittyä eiliseen tietoon siitä, että Omikron on johtanut merkittävään lasten erikoissairaanhoidon kasvuun.
10/x

sampo.thl.fi/pivot/prod/fi/…
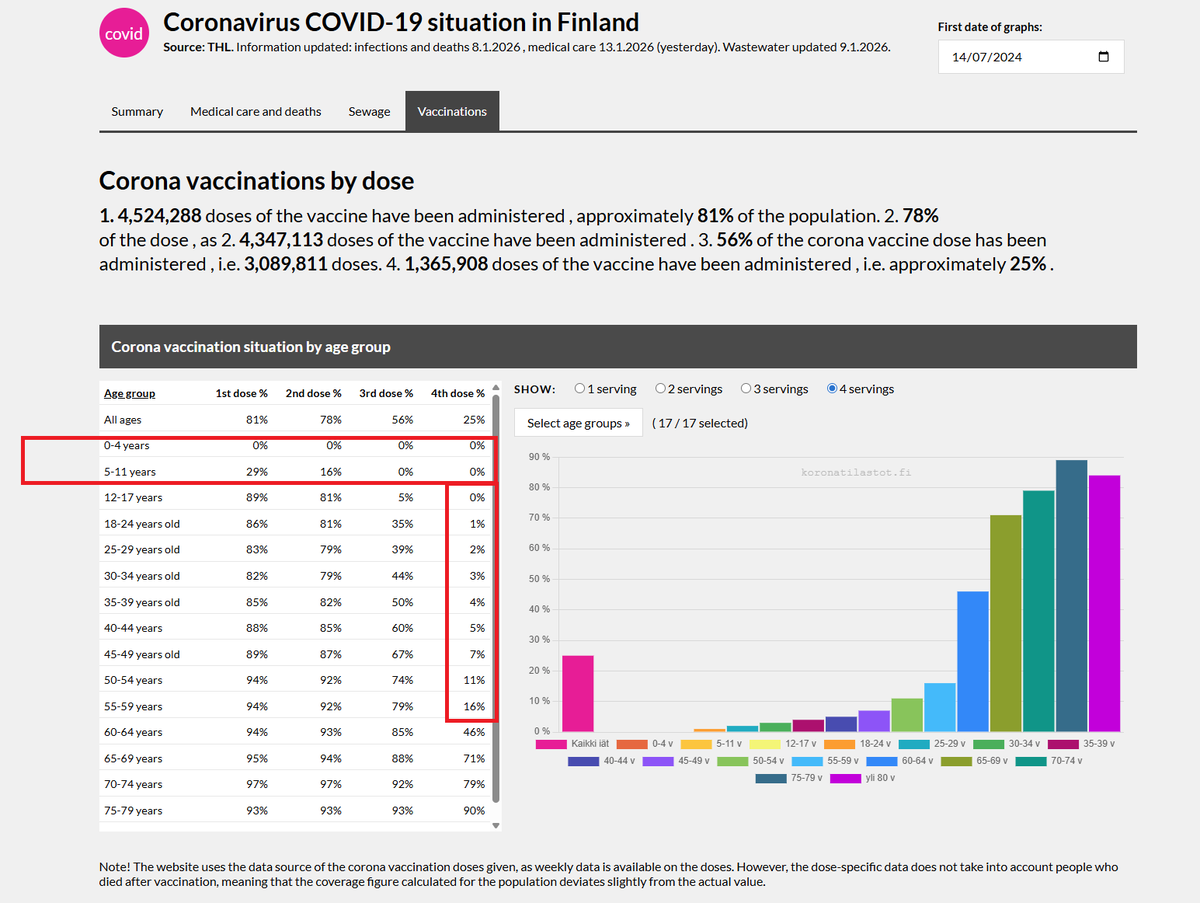
Tässä eilisen tilannekatsauksen materiaalien perusteella laskettu kuva lasten erikoissairaanhoidon tarpeen kehityksestä. Onko odottavat äidit priorisoitu 3. rokotusten antamisessa ? Onko odottavien äitien 3. rokotuksia kiirehditty ?
11/x

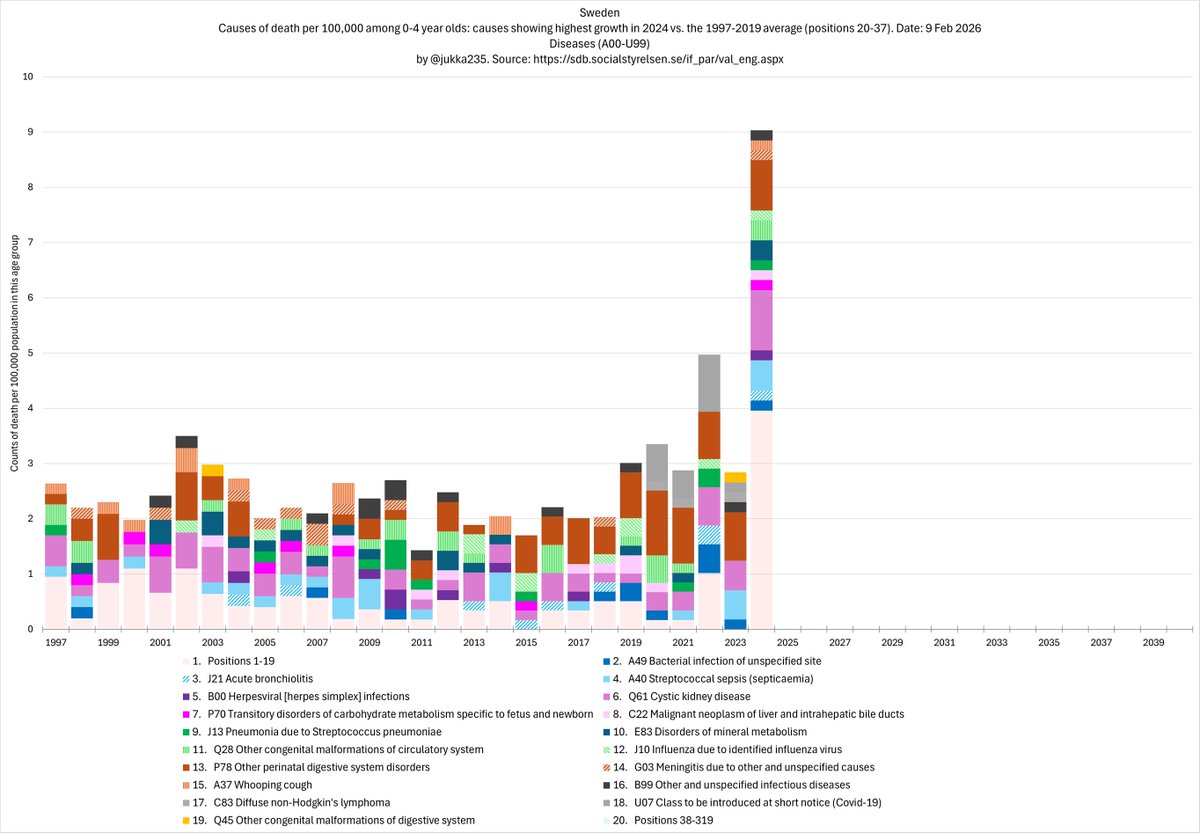
Eniten nousseet lasten epämuodostumien koodit ovat
- Q61 munuaisten rakkulasairaus
- Q21 sydämen väliseinien epämuodostumat
- Q87 useisiin elimiin kohdistuvat epämuodostumat
tämä siis ei prosentteina vaan absoluuttinen määrän nousu. Vuoden 2022 luvut on annualisoitu.
12/x
Tässä sama suomenkielisillä koodeilla. Pelkästään tammikuussa käytiin 7613 kertaa lääkärissä, mikä vastaa melkein yhtä kolmasosaa (31 prosenttia) koko 2018-2019 keskiarvosta (24400 käyntiä).
13/x
Suurin prosentuaalinen lasten epämuodostumien kasvu näyttää liittyvän silmiin, sormiin, varpaisiin, munuaisiin ja virtsatiehen. Jos kerroin on yli 12, niin käyntejä on ollut tammikuussa enemmän kuin koko vuonna 2021 yhteensä.
14/x
Tässä suomenkieliset koodit. Suurin prosentuaalinen lasten epämuodostumien kasvu näyttää liittyvän silmiin, sormiin, varpaisiin, munuaisiin ja virtsatiehen.
15/x
Tässä on yhdistettu lasten epämuodostumien prosentuaalinen kasvu ja absoluuttinen kasvu.
16/x
Tässä sama kuva englanninkielisillä koodeilla. Sääliksi käy lapsia.
17/x
Positiivisten osuuden lasku on hidastunut. Palaan tähän perjantain 4.2. ketjussa.
18/x
THL ilmoittaa, että lasten epämuodostumisten käsittelyssä on ollut virhe. Jään odottamaan uusia tietoja.
19/

Kävin THL:n korjaamattomia lukuja läpi. Siellä näyttää olevan selvä virhe 2022 luvuissa. Sen olemassaolon voi päätellä siitä, että virhe toistuu suunnilleen saman suuruisena kaikissa ikäluokissa.
20/x

• • •

Missing some Tweet in this thread? You can try to force a refresh
 

Keep Current with Ilkka Rauvola

Ilkka Rauvola Profile picture

Stay in touch and get notified when new unrolls are available from this author!

Read all threads

This Thread may be Removed Anytime!

PDF

Twitter may remove this content at anytime! Save it as PDF for later use!

Try unrolling a thread yourself!

how to unroll video
  1. Follow @ThreadReaderApp to mention us!

  2. From a Twitter thread mention us with a keyword "unroll"
@threadreaderapp unroll

Practice here first or read more on our help page!

More from @jukka235

Feb 13
Mortality in Sweden: Are the causes of death that are increasing among 0-4, 5-9 and 10-14 year olds also rising in older age groups?

Let's find out.
1/x Image
These causes collectively represent all causes of death that are rising among 0-4, 5-9 and 10-14 year olds. Among 0-4 year olds, their average growth rate (2019-2024) is 13.5%.
2/x Image
Among 5-9 year olds the average annual growth rate (2019-2024) is 33.8 percent (10-fold in 7.9 years if this growth rate continues).
3/x Image
Read 19 tweets
Feb 9
Mortality of children aged 0-4 in Sweden.
1/x Image
Among 0-4 year olds, the 19 causes of death with the highest growth (2004 compared with the 1997-2019 average) have increased since 2019 at an average rate of 51% per year.
2/x Image
Among 0-4 year olds, adding the next 18 causes brings the total to the top 37 fastest growing causes of death. Together, these have increased since 2019 at an average rate of 24.6% per year, compared with just 0.6% per year during 1997-2019.
3/x Image
Read 6 tweets
Feb 8
Mortality of 10-14 year olds in Sweden.
1/x Image
Here are the 19 leading causes of death among 10-14 year olds, ranked by their 2024 incidence compared to the 1997-2019 average. Together, they account for 35% of all deaths in 2024.
2/x Image
Here are the next 18 diseases. Combined, these causes represent 60% of all deaths in 2024, and have an average growth rate of 33.7% per year between 2019 and 2024 (10 times in 7.9 years).
3/x Image
Read 8 tweets
Jan 15
Diseases of the nervous system (G00-G99).
1/x Image
Between 2020 and 2025e, patient growth is nearly uniform across all age groups above one year of age. However, growth among those aged 1-64 clearly exceeds that observed in older age groups.
2/x Image
Situation by disease group (nervous system diseases G00-G99):
- fastest growth (2020–2025e): Other disorders of the nervous system (G90–G99), 15.9% average annual growth
- fastest growth (2024-2025e): Inflammatory diseases of the central nervous system (G00–G09), 19.7%
3/x Image
Read 14 tweets
Jan 14
This is an important moment.

After more than five years of silence, mainstream media has begun to acknowledge that C19 can harm T cells, and to discuss the consequences that follow. @fitterhappierAJ was one of the first, if not the first, to talk about this.
1/x
Dr. Leonardi has provided a significant amount of direction for me. In particular, he has been interviewed in some excellent articles that have withstood the test of time. Here is one of them.
2/x

thetyee.ca/Analysis/2022/…
We have seen it all.
- in 2020, they said that our health systems are so robust that this disease wouldn't come here
- then they wanted them infected. C19 was de facto allowed to spread in schools. Only a small fraction of <12 year olds received ...
3/x

koronatilastot.fi/fi/rokotukset/Image
Read 8 tweets
Jan 9
Something is causing injuries among young children.
1/x Image
Something changed in 2022. Before that, the numbers were generally falling. Wonder what it could be.
2/x Image
After 2022, 1-6 year olds have overtaken a total of three other age groups (50-64, 15-24 and 65-74 year olds), and are now clearly above the total population average. All injuries (S00-S99).
3/x Image
Read 6 tweets

Did Thread Reader help you today?

Support us! We are indie developers!


This site is made by just two indie developers on a laptop doing marketing, support and development! Read more about the story.

Become a Premium Member ($3/month or $30/year) and get exclusive features!

Become Premium

Don't want to be a Premium member but still want to support us?

Make a small donation by buying us coffee ($5) or help with server cost ($10)

Donate via Paypal

Or Donate anonymously using crypto!

Ethereum

0xfe58350B80634f60Fa6Dc149a72b4DFbc17D341E copy

Bitcoin

3ATGMxNzCUFzxpMCHL5sWSt4DVtS8UqXpi copy

Thank you for your support!

Follow Us!

:(