Massive adjustments to the Vestmannaeyjar (Iceland) temperature record by NASA GISS: 

Yet almost every adjustment cools the past and warms the present:
data.giss.nasa.gov/gistemp/histor…
data.giss.nasa.gov/gistemp/histor…
"Starting in the 1990s, the methodology eliminated or corrected unrealistic outliers"
Who decides if they are unrealistic?
Who decides if they are unrealistic?
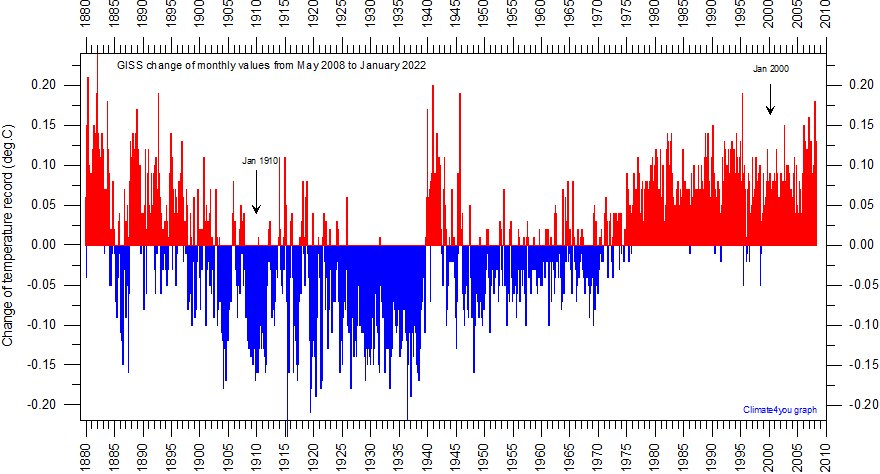
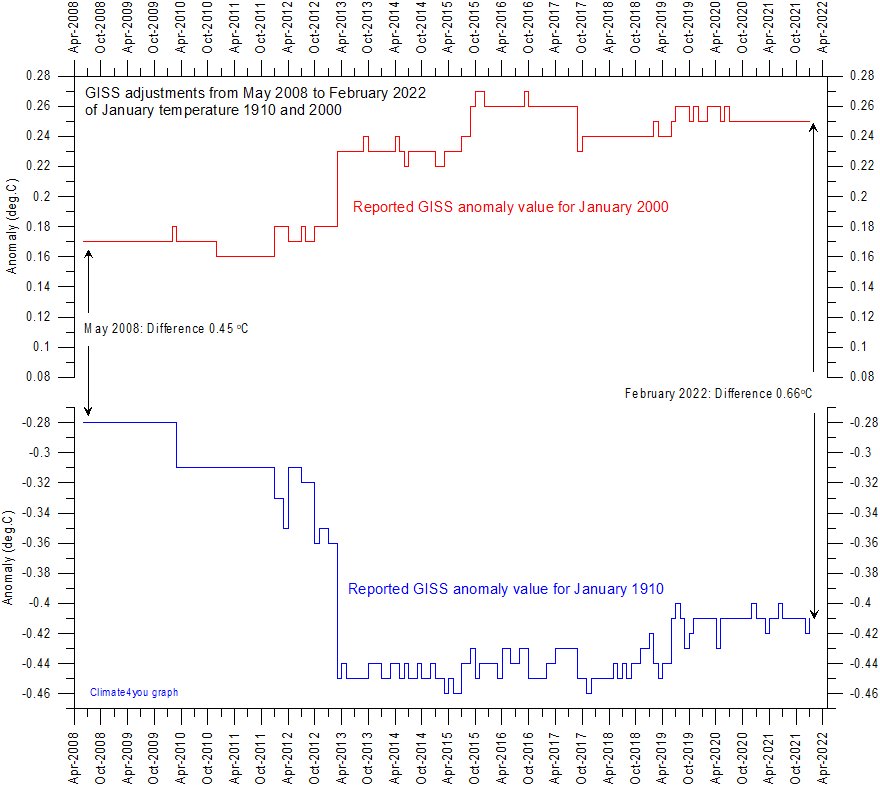
"The net effects of the adjustments [to NASA GISS] made since May 2008 are to generate a more smoothly increasing global temperature since 1880"
https://t.co/ETZNnx4f97climate4you.com
https://t.co/ETZNnx4f97climate4you.com
And you still trust NASA? I don't. Reading this makes me more sceptical. It's a story of data adjustments to fit Dr Hansen's "concerns".
data.giss.nasa.gov/gistemp/histor…
data.giss.nasa.gov/gistemp/histor…
" A temperature record which keeps on changing the past hardly can qualify as being correct"
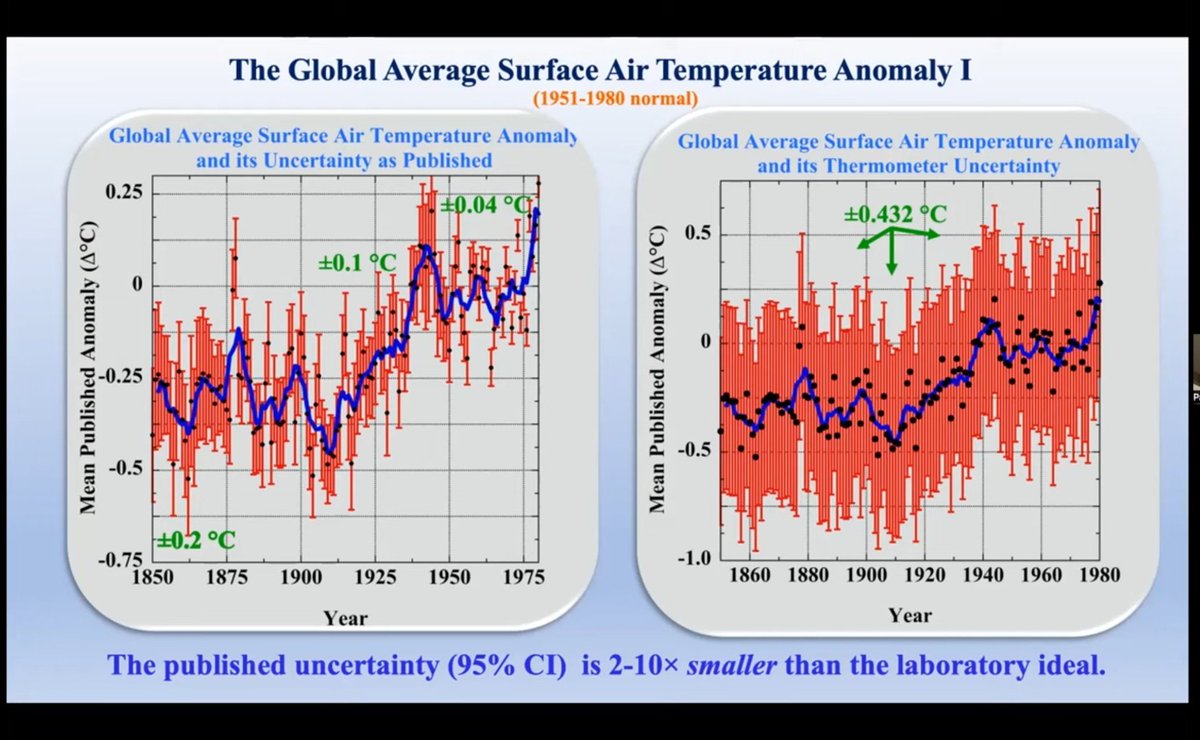
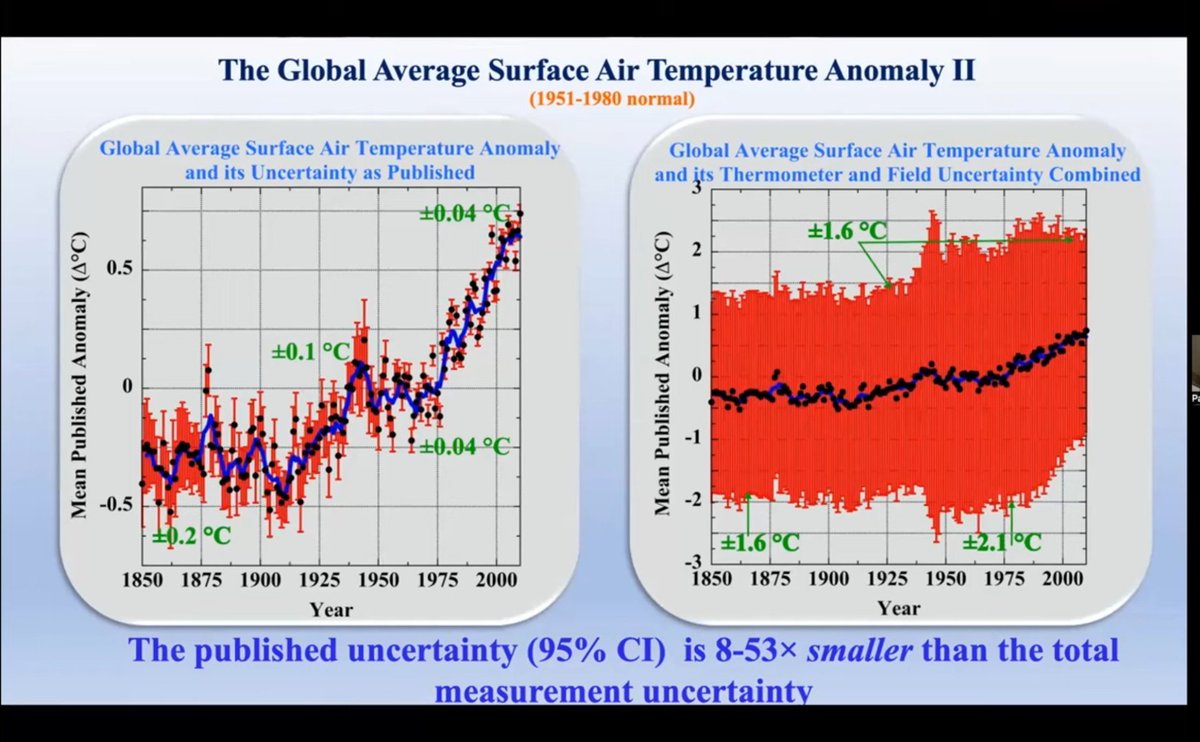
The temporal stability of global air temperature estimates is documented here:
climate4you.com
The temporal stability of global air temperature estimates is documented here:
climate4you.com
Every where you look, long term stations (late 1800s to present) have massive adjustments to remove multi-decadal variability. Here's Richfield, California:

Cool the past
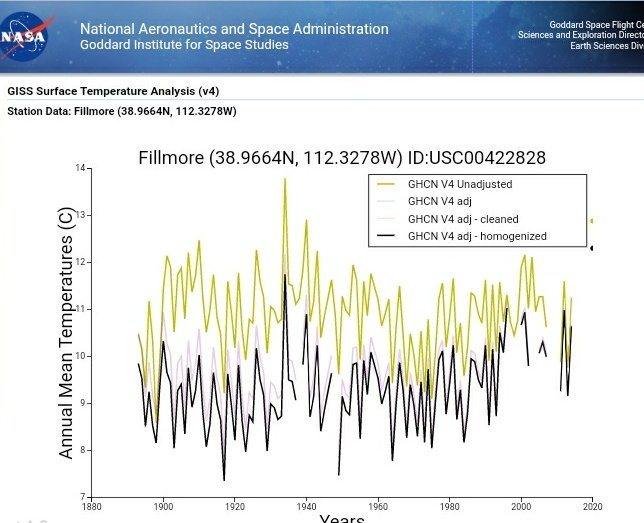
Cooling the past
Deleting the past
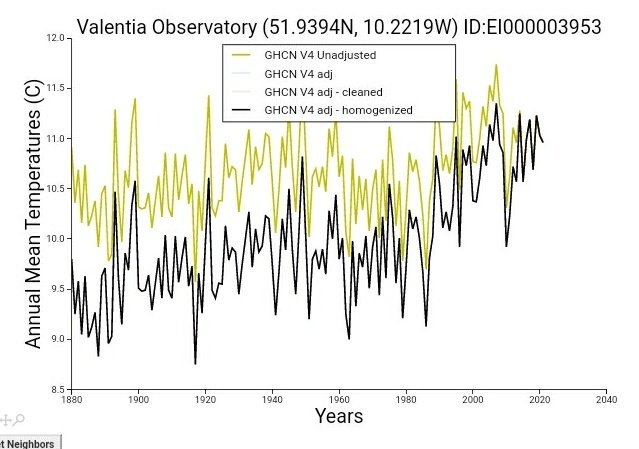
Valentia Observatory, Ireland. Seems legit.
Cooling the past in Pakistan

Cooling the past in Rocha, Uruguay

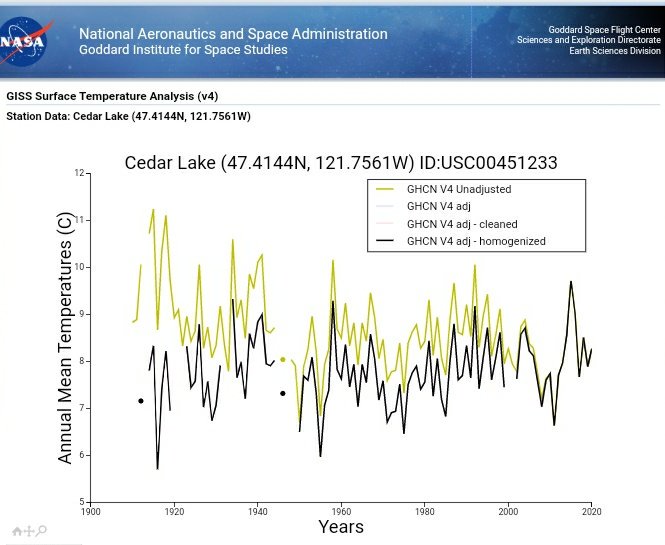
Cooling the past in Cedar Lake, Indiana.
San Antonio, Argentina, cooling the past to create warming.

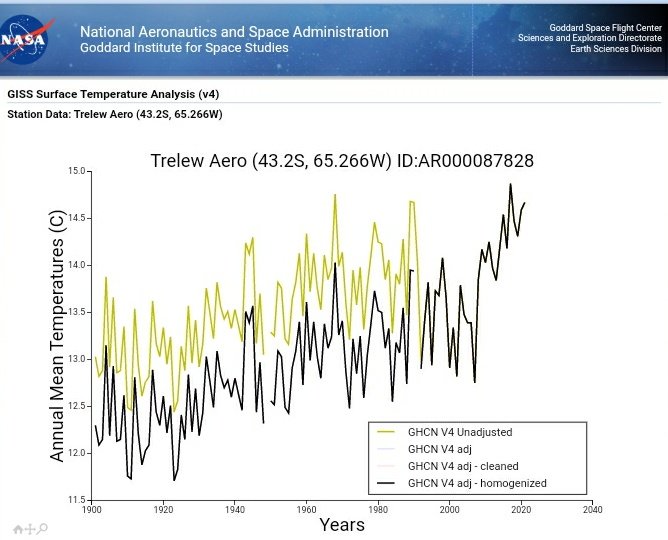
Removing multi-decadal variability in Trelew, Argentina
Cooling the past in Deer Lake, Newfoundland, Canada.

Cooling the past at Resolution Island, Canada.

@Daniel_Marbella Because
1. Most of the adjustments gradually cool the past by increasing amounts
2. This removes multidecadal variability
3. It looks like the temp record is being adjusted to fit a theory.
1. Most of the adjustments gradually cool the past by increasing amounts
2. This removes multidecadal variability
3. It looks like the temp record is being adjusted to fit a theory.
Tromsolangnes, Norway; deleting the 1920-1960 warm period.

It's strange that it's very hard to find a Russian station in this dataset that shows unadjusted temperature, only 'final' homogenised data. Why is the raw unadjusted data largely unavailable for Russia? And who has done the homogenisation, if not NASA?
How to turn a long term cooling trend into a warming trend, in Nelson New Zealand

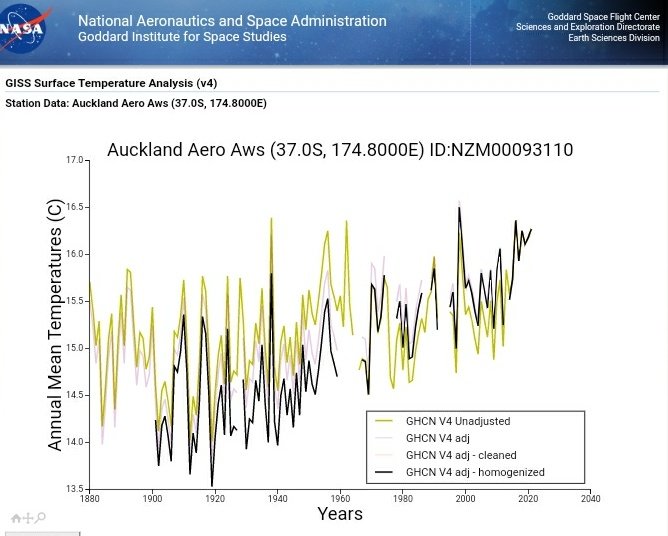
Cooling the past, warming the present in Aukland, New Zealand. This one has a BI of 30, so effected by urbanisation, yet late 20thC temps are adjusted upwards, not down as they should be.
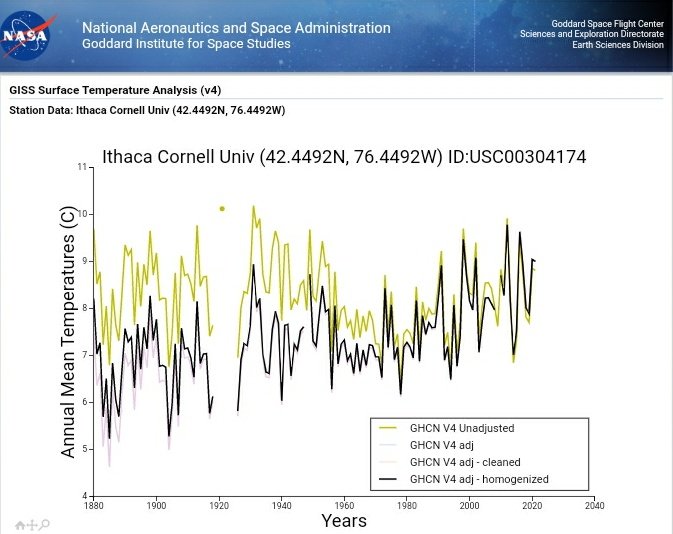
Cooling the past at Ithaca University, New York
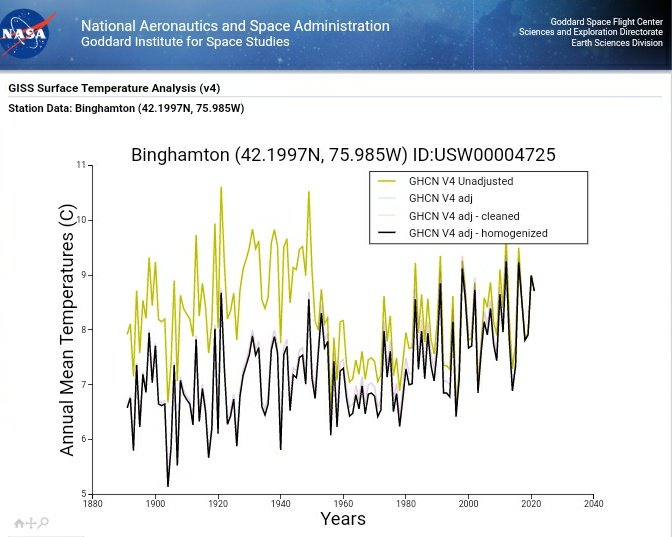
Cooling the past to create a warming trend in Binghamton, New York state.
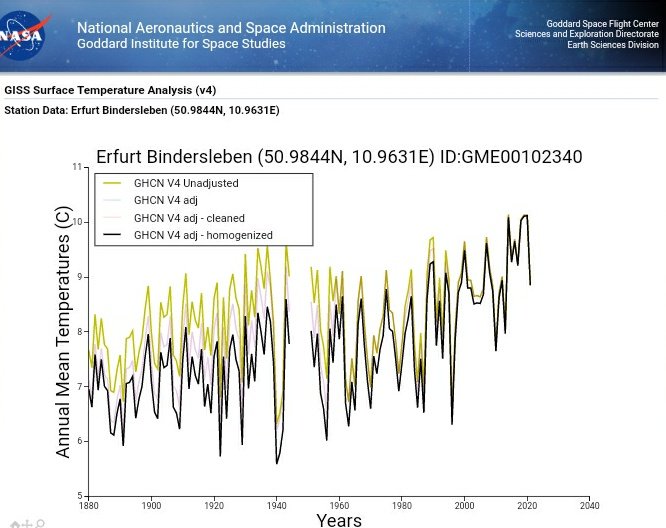
Cooling the past to manufacture warming in Erfurt, Germany
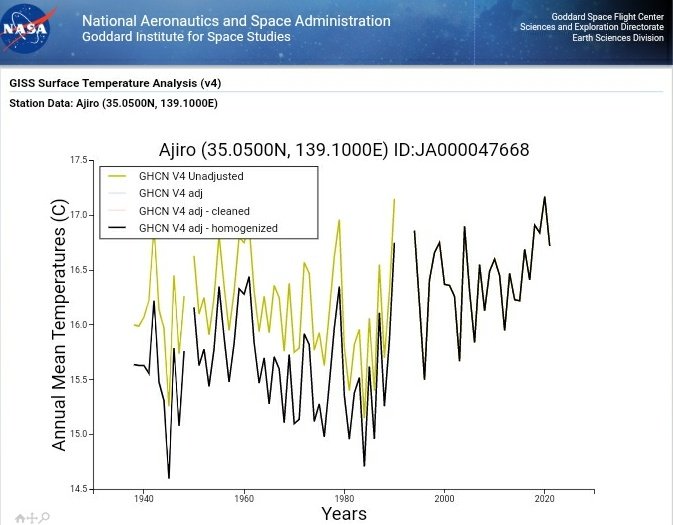
Cooling the past in Ajiro, Japan. Note, this has a BI of 10 = recent warming due to UHI effect.
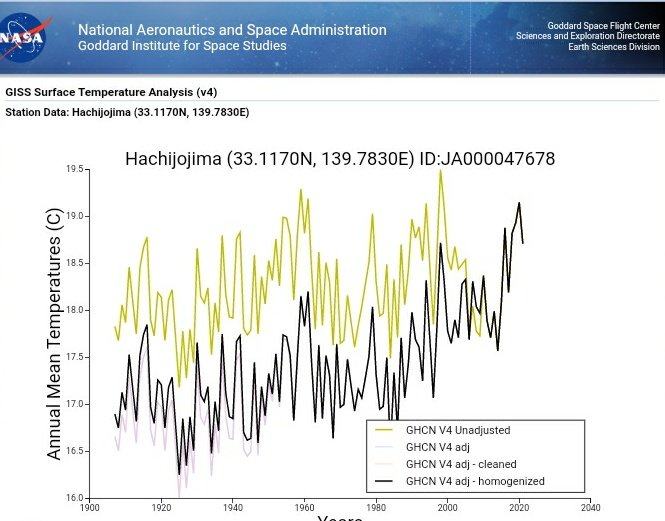
Hachijojima, Japan. Unadjusted = no trend; adjusted = steep warming. Seems legit.
Welcome to the adjustocene.

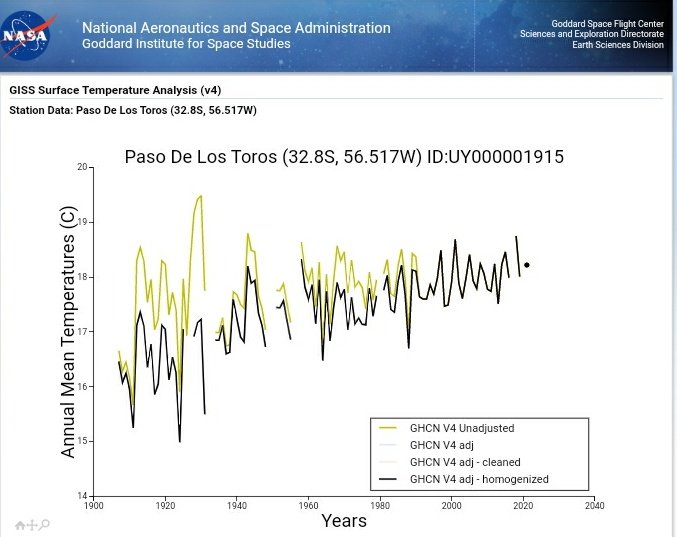
Paso De Los Toros, Uruguay. Cooling the past to manufacture warming.
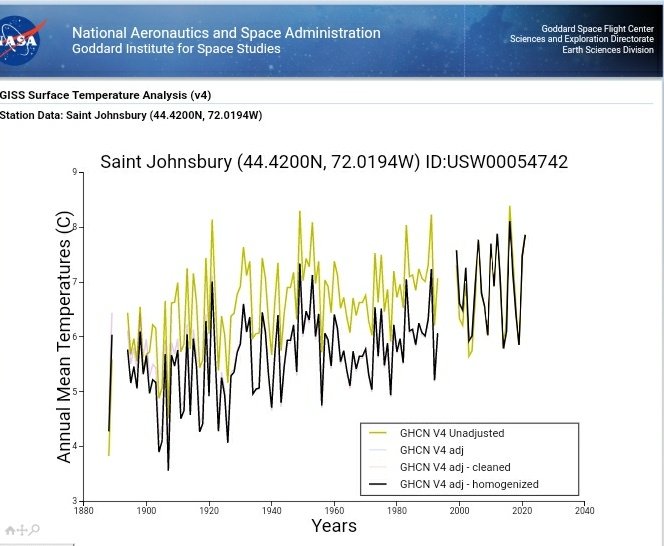
Saint Johnsbury, Vermont. Cooling the past to create warming since 1880.
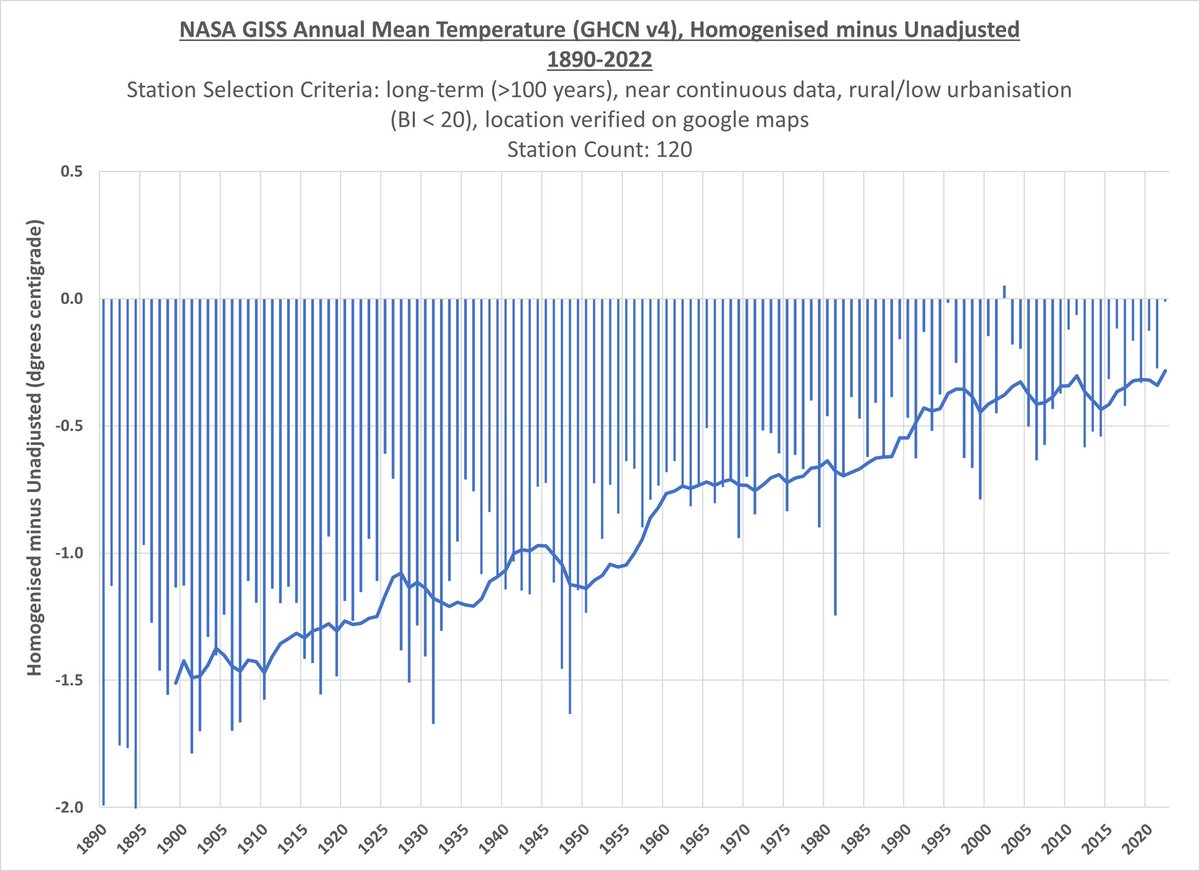
0.2degC of global warming is from retrospective adjustments made since 2008. Cool the past (1910), warm the present (2000):
Phil Jones to Mike Mann & Gavin Schmidt, April 2007:
NOAA likely to "raise recent temps and also reduce earlier temps (pre -1940) for reasons that aren't that clear".
"Upshot is that their trend will increase"
https://t.co/jqb1s6M7EGsealevel.info/FOIA/0121.txt
NOAA likely to "raise recent temps and also reduce earlier temps (pre -1940) for reasons that aren't that clear".
"Upshot is that their trend will increase"
https://t.co/jqb1s6M7EGsealevel.info/FOIA/0121.txt

@Daniel_Marbella euanmearns.com/the-worst-of-b…
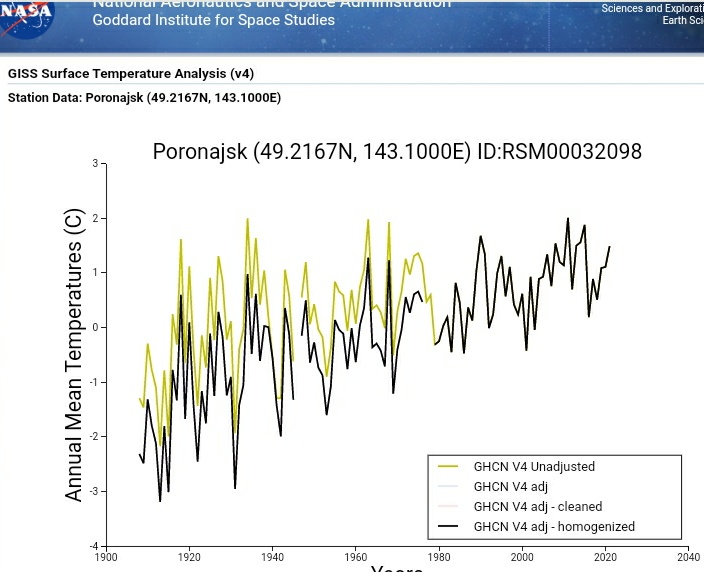
More cooling the past at Poronajsk, Sakhalin Island, Russia.
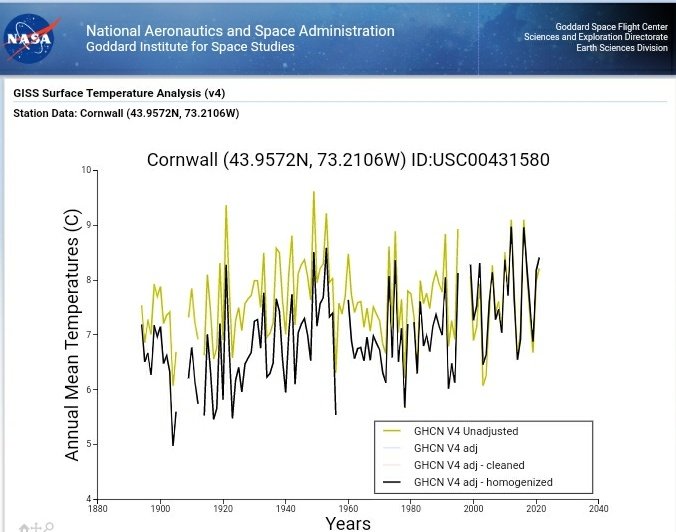
Cooling the past to manufacture warming in Cornwall, Vermont, US:
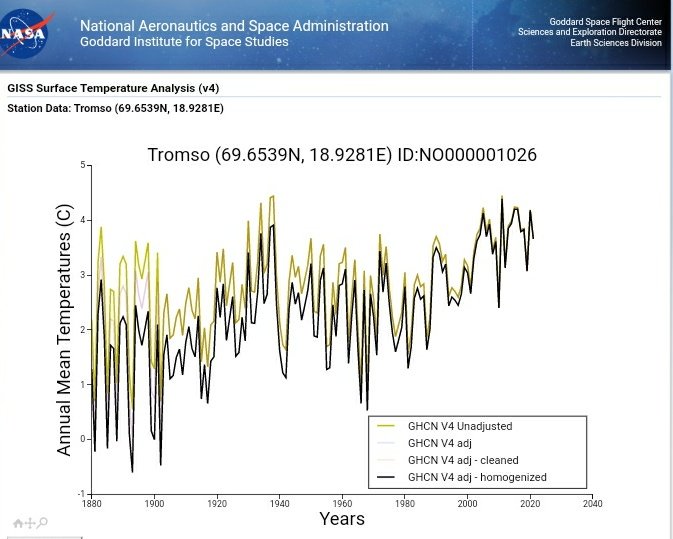
Tromso, northern Norway. Should have adjustments to cool the recent due to significant UHI effect (BI of 89), yet the past is cooled to manufacture warming.
Gradually cooling the past to create warming in Nome, Alaska. BI is 39, so the recent uptick is likely Urban Heat Island effect.

Cooling the past to create a strong warming trend, in Zurich, Switzerland:

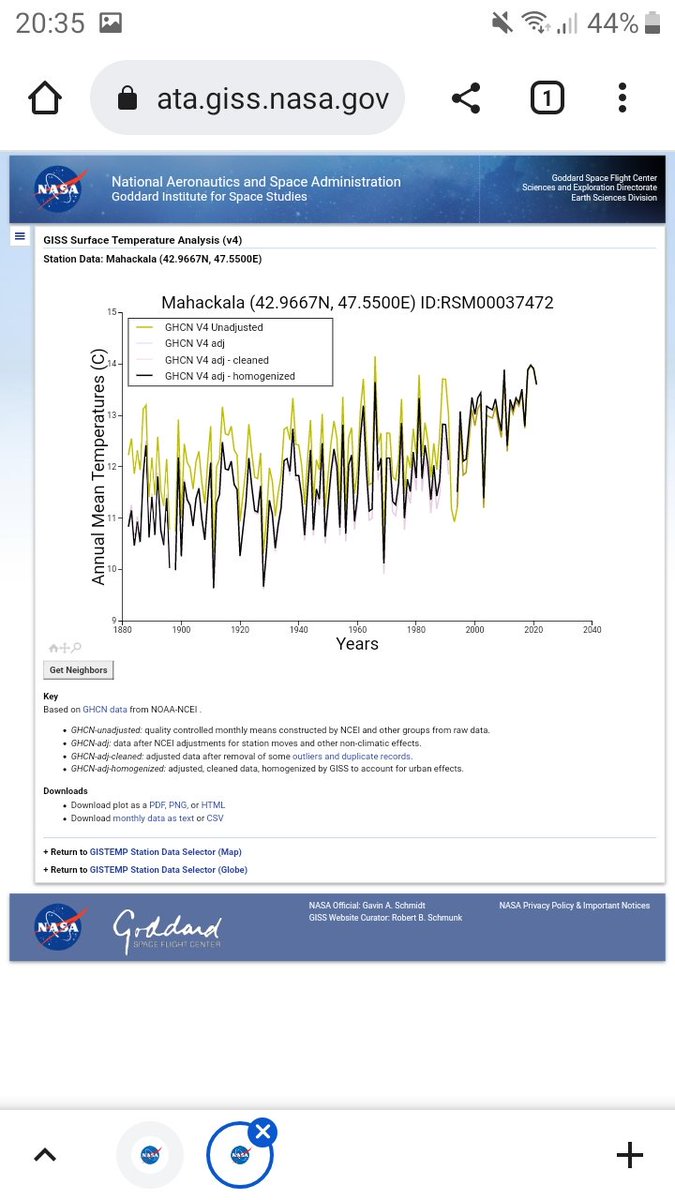
Only slight warming in Mahackala, Dagestan, Russia, until adjustments cool the past to create strong warming trend:
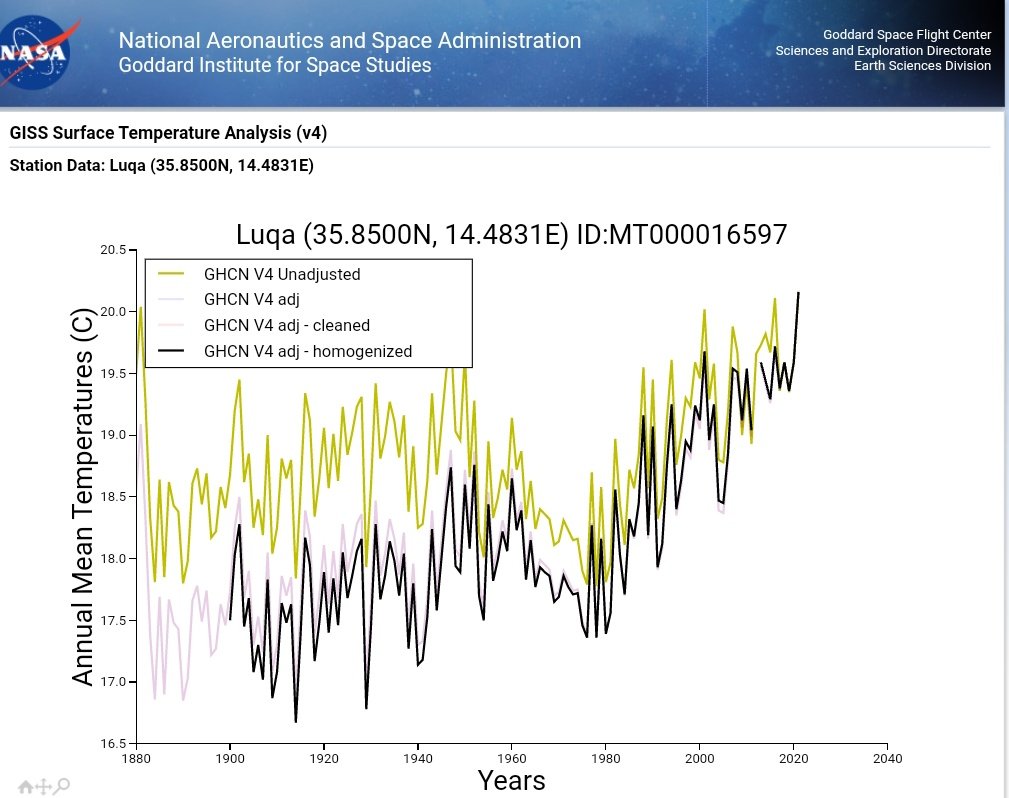
Massive adjustments to cool the past and remove multi-decadal variability in Luqa, Malta (BI 33 = recent uptick is UHI effect).
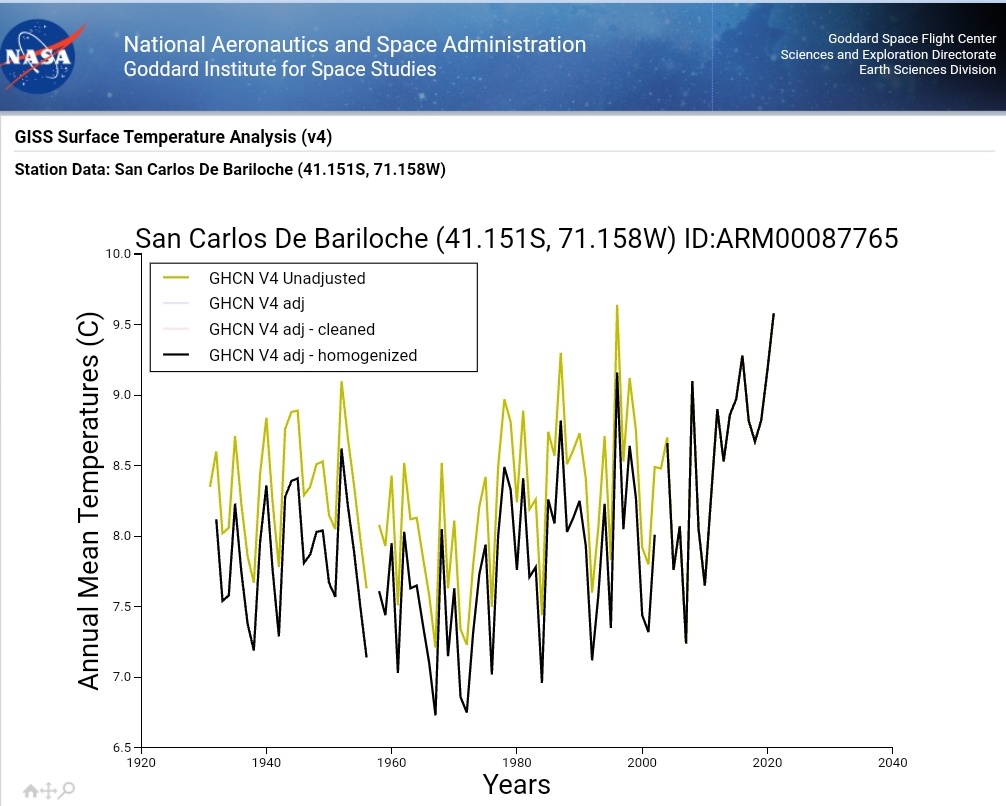
Manufacturing a warming trend in San Carlos De Bariloche, Argentina:
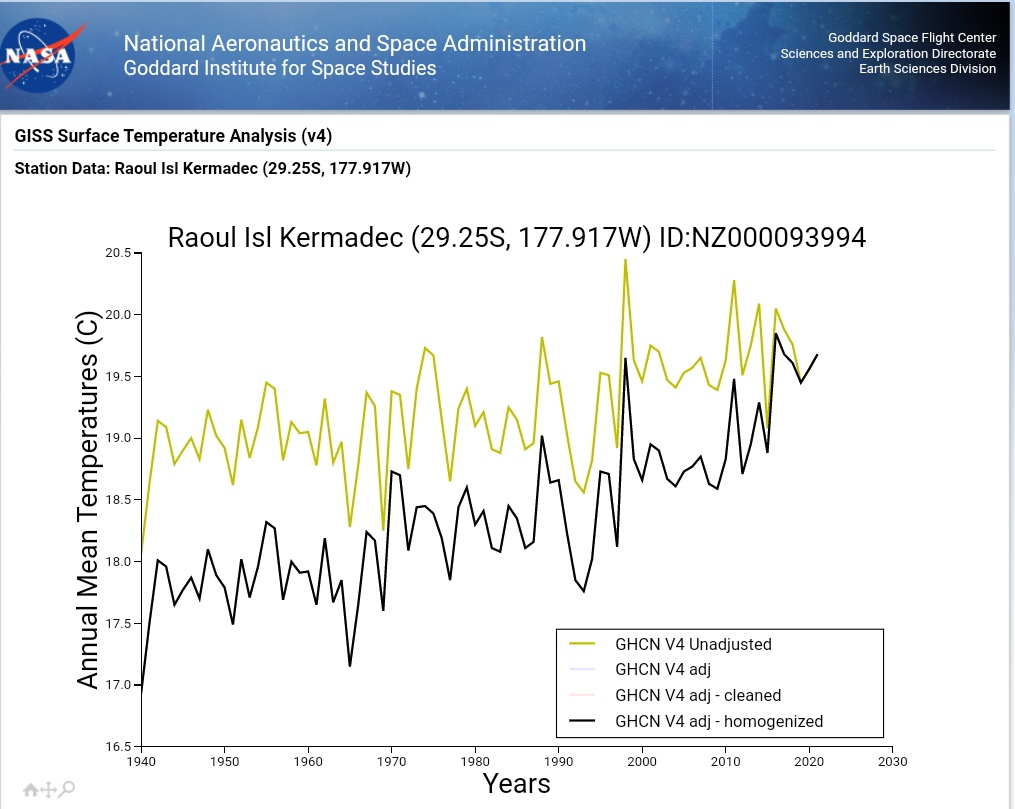
How is this not fraud? Raoul Island, New Zealand.
Manufacturing a warming trend in Ono I Lau, Fiji.

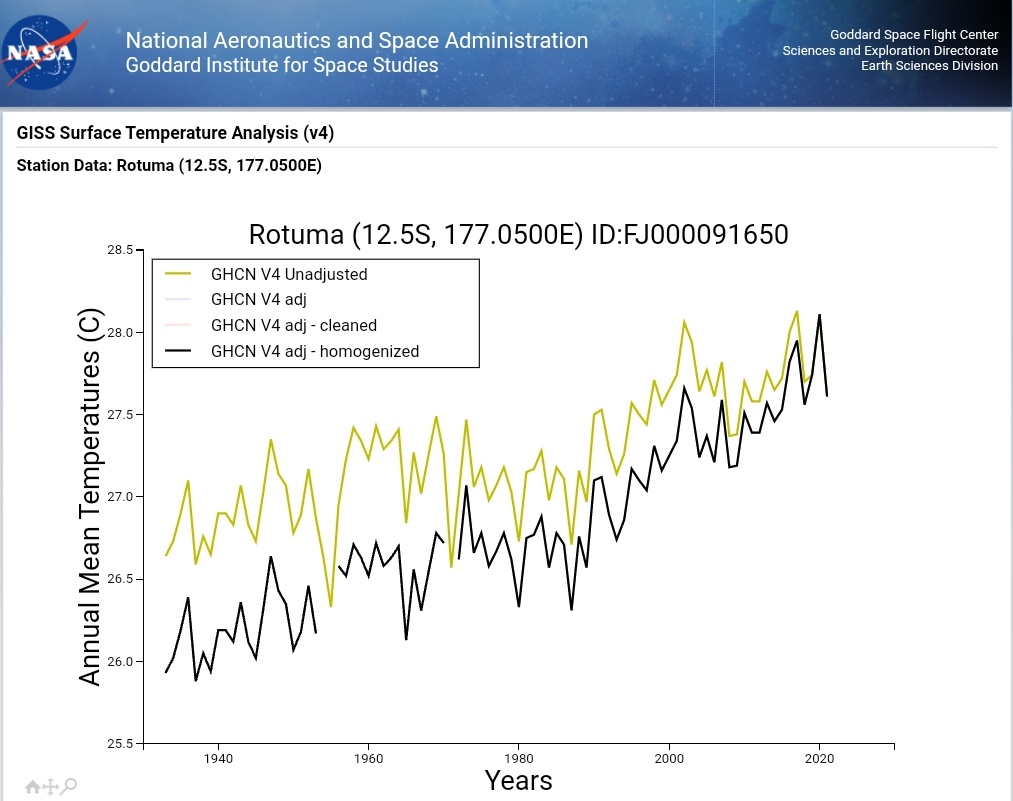
Manufacturing a steeper warming trend by cooling the past in Rotuma, Fiji:
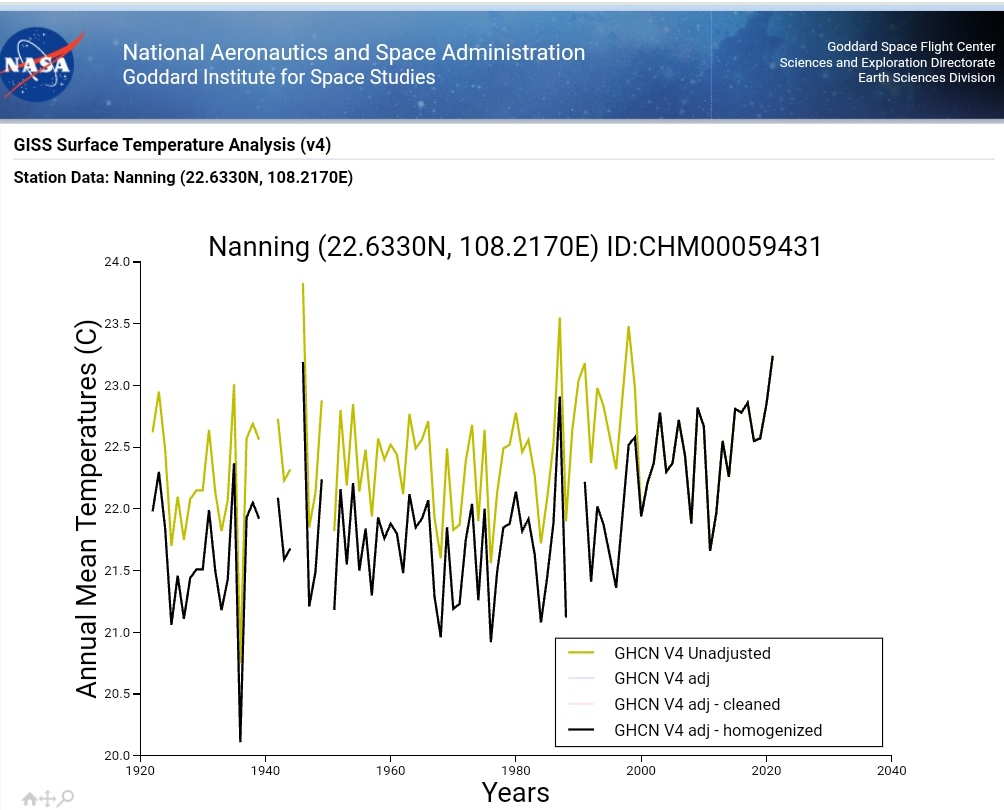
Cooling the past in Nanning, China:
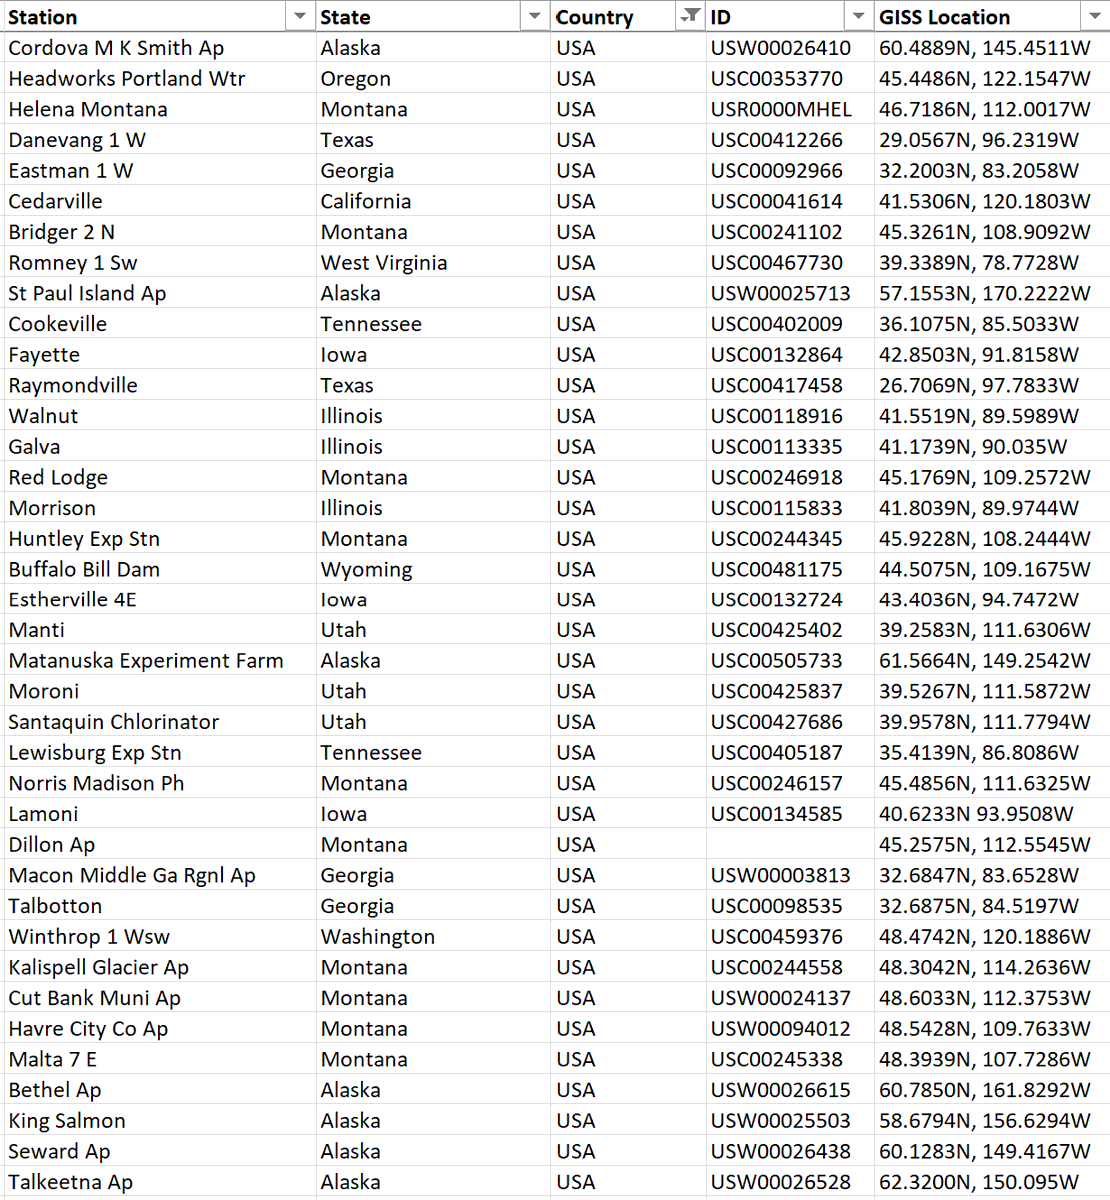
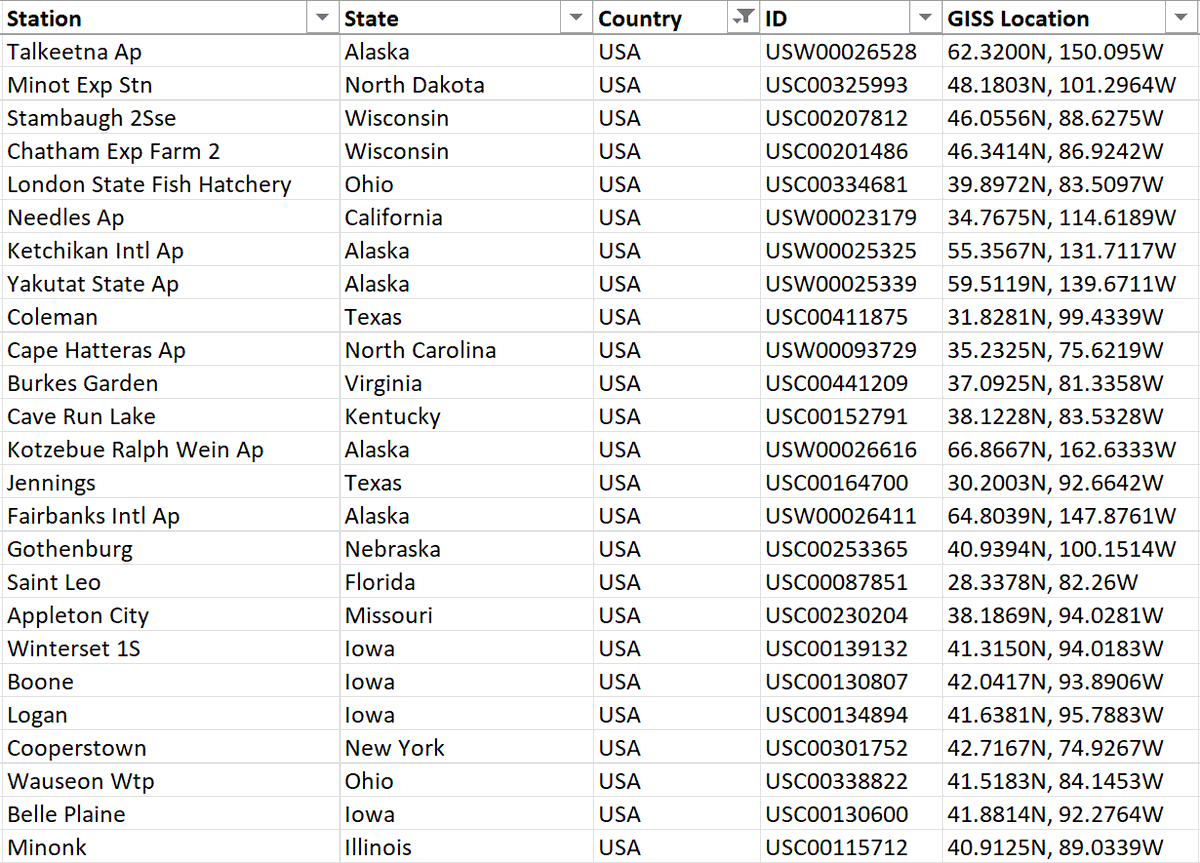
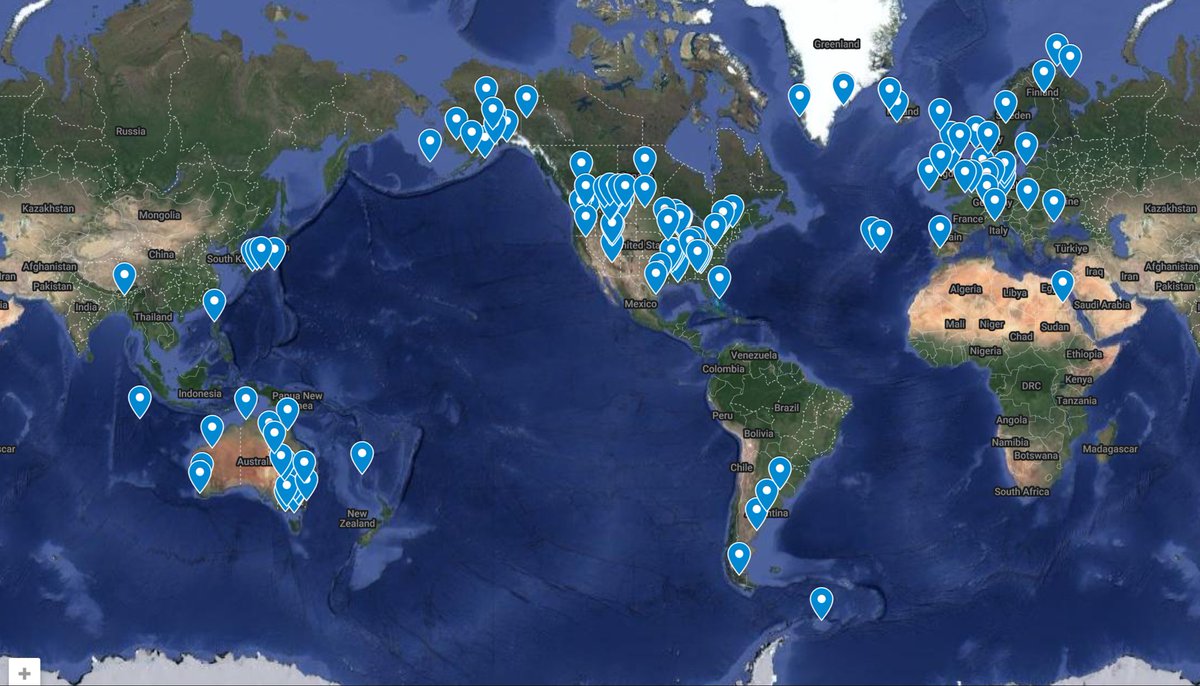
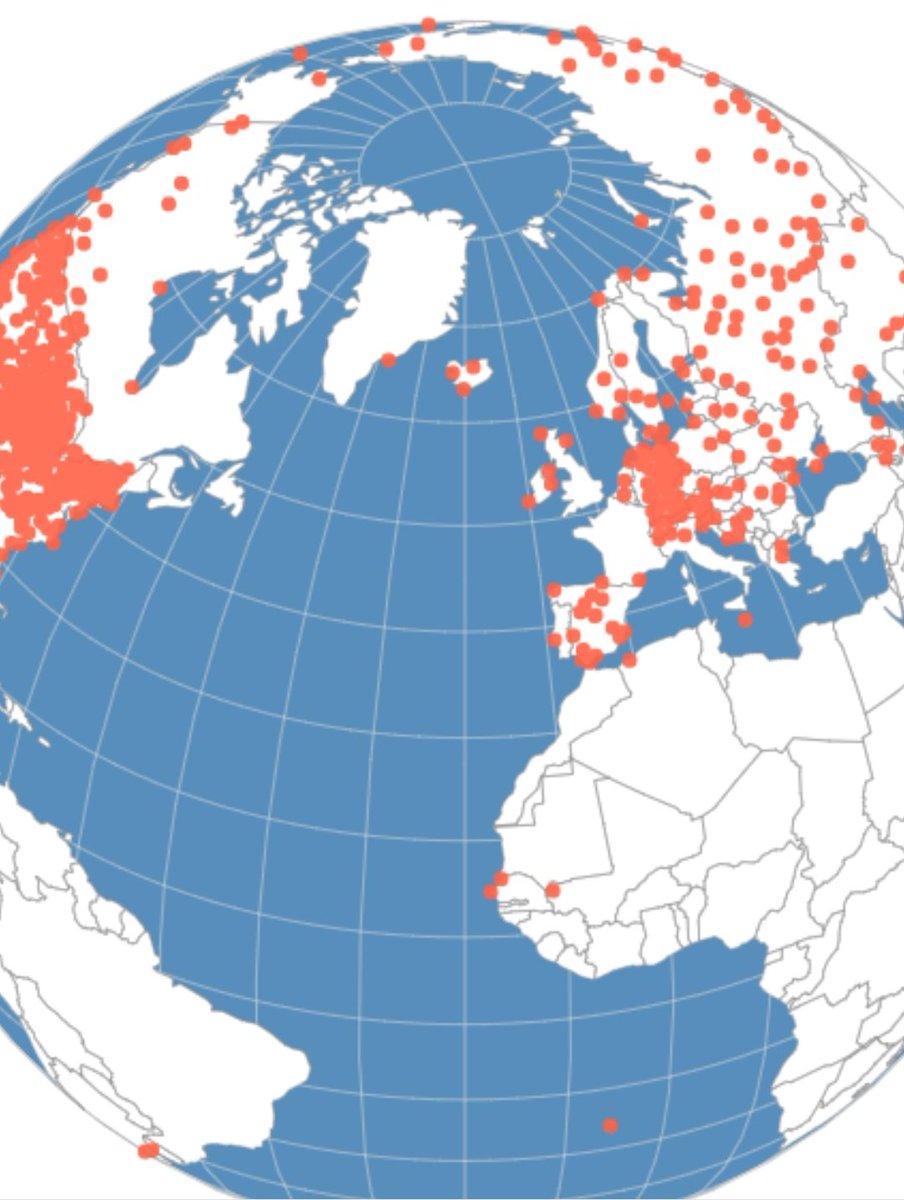
@Daniel_Marbella Stations with data from 1900-2022:
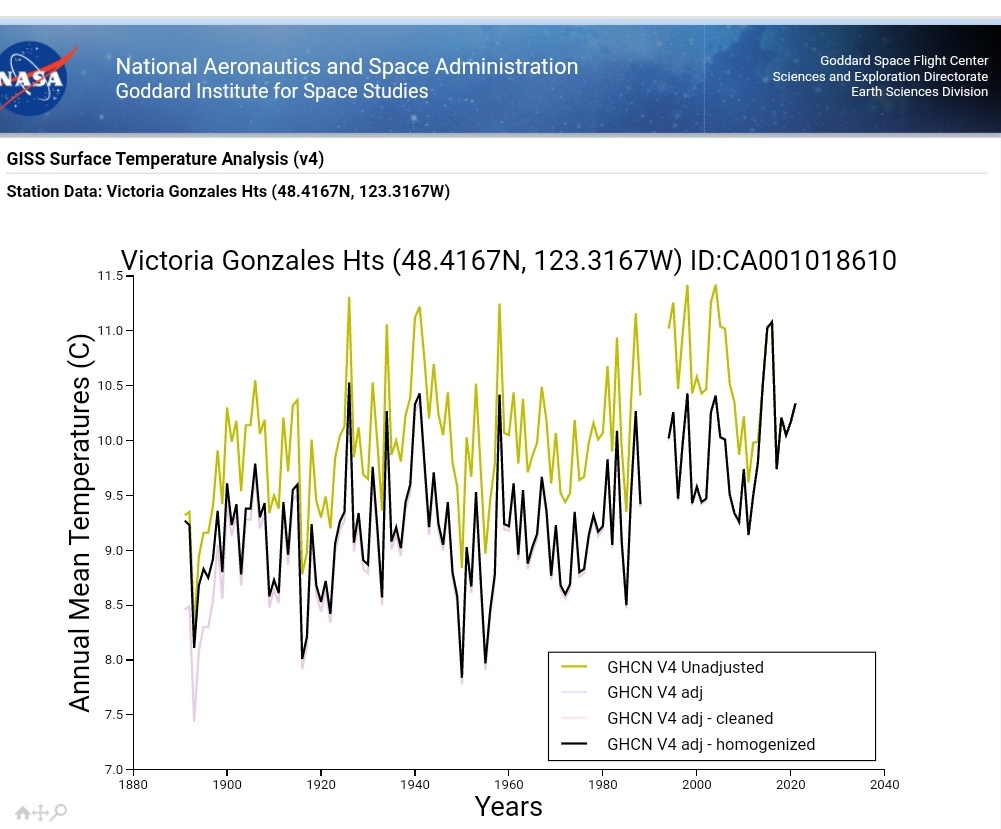
Victoria Gonzales Heights, Canada, no warming prior to adjustments:
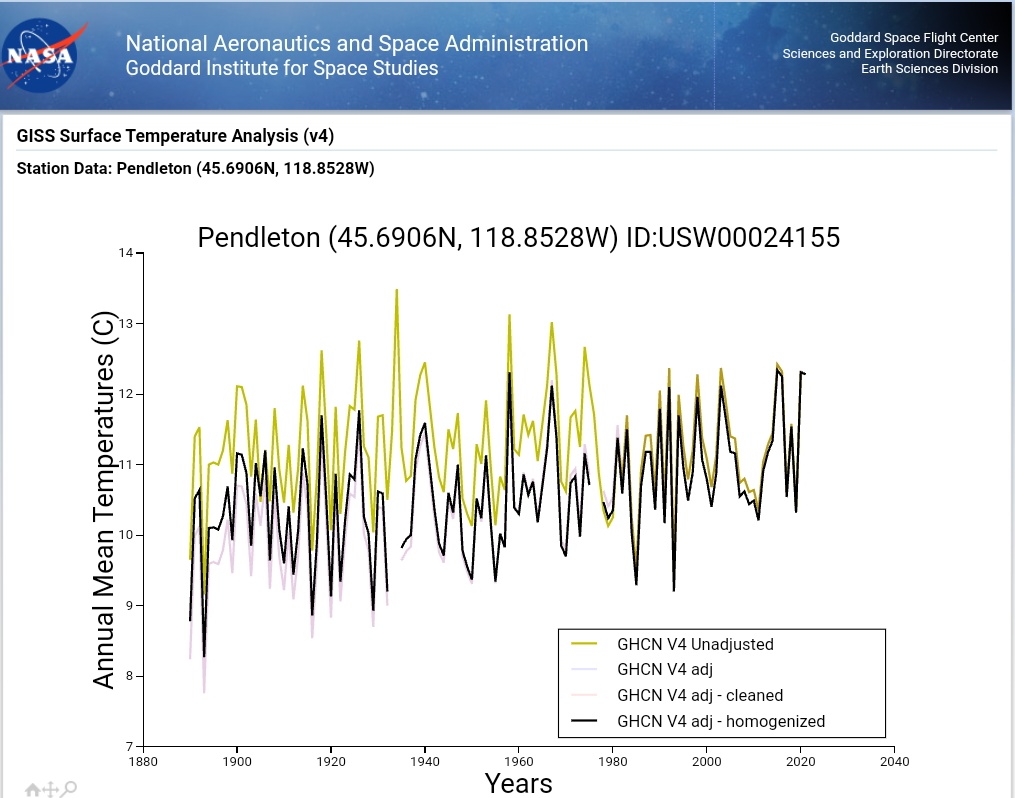
No warming in Pendleton, Oregon, United States, before adjustments:
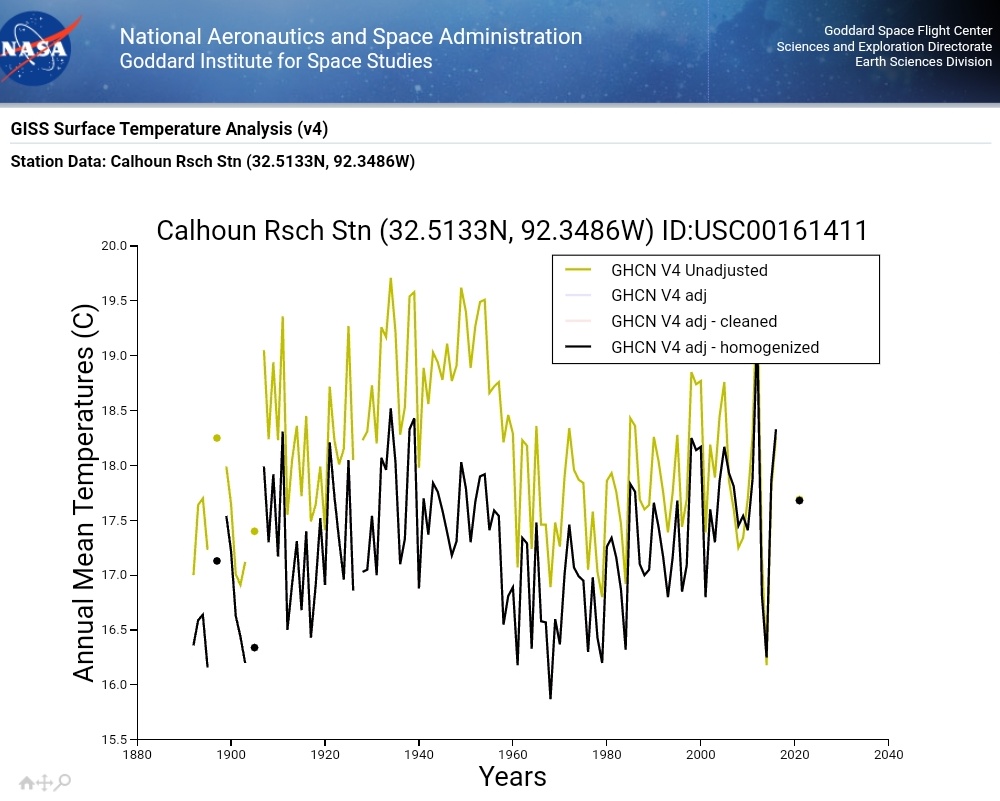
Deleting multi-decadal variability to create warming at Calhoun Research Station, Louisiana, US:
Manufacturing warming in Makedonia, Greece (BI 24 so recent uptick is UHI effect).

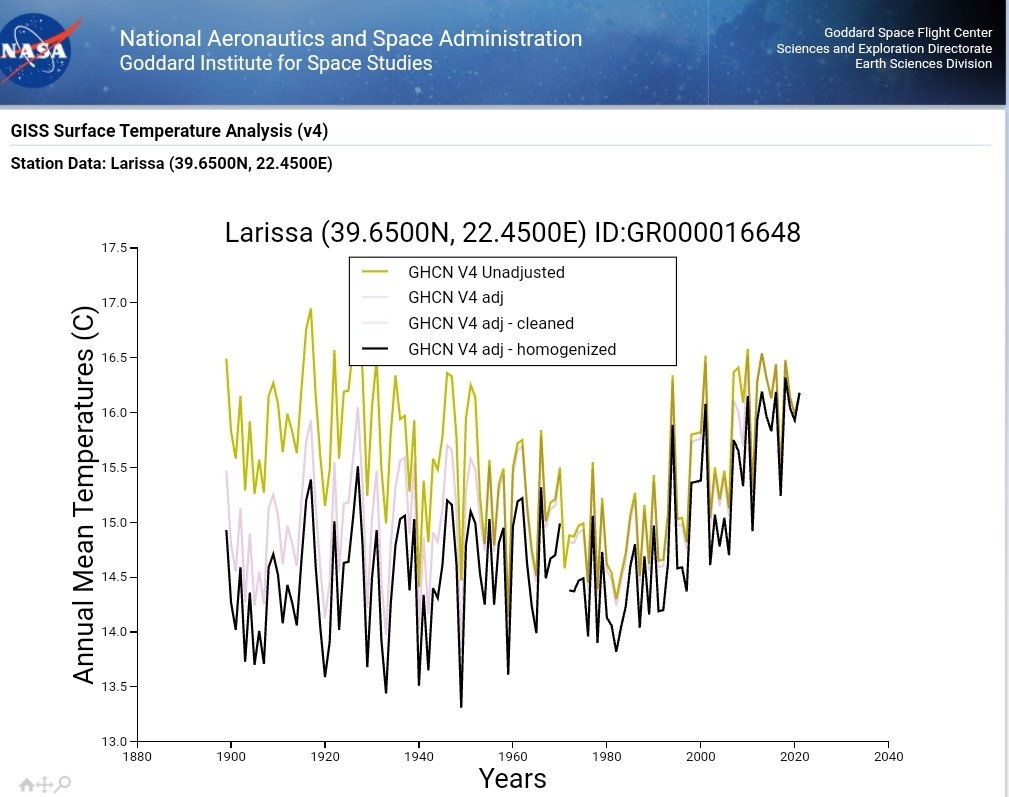
Cooling the past and removing natural variability to create a warming trend in Larissa, Greece (BI 25 = some recent UHI effect).
Cooling the past in Palmerville, Queensland, Australia.

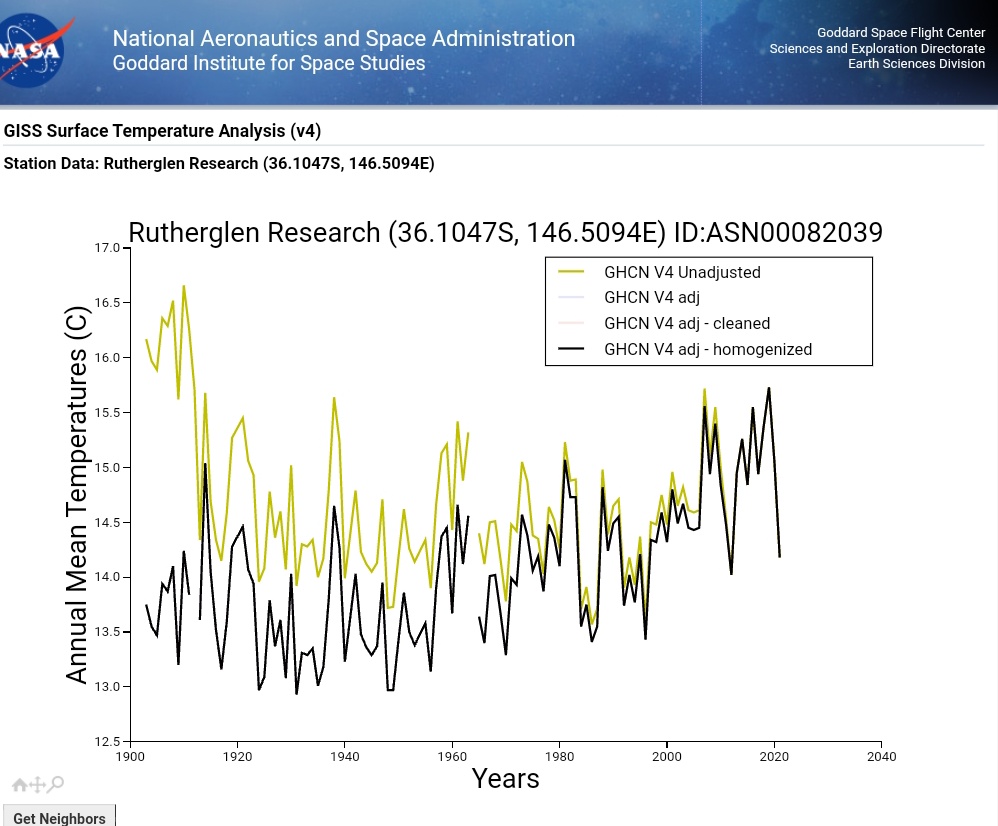
Cooling the past to create warming in Rutherglen, Victoria, Australia:
Another one: Alice Springs, Northern Territory, Australia.

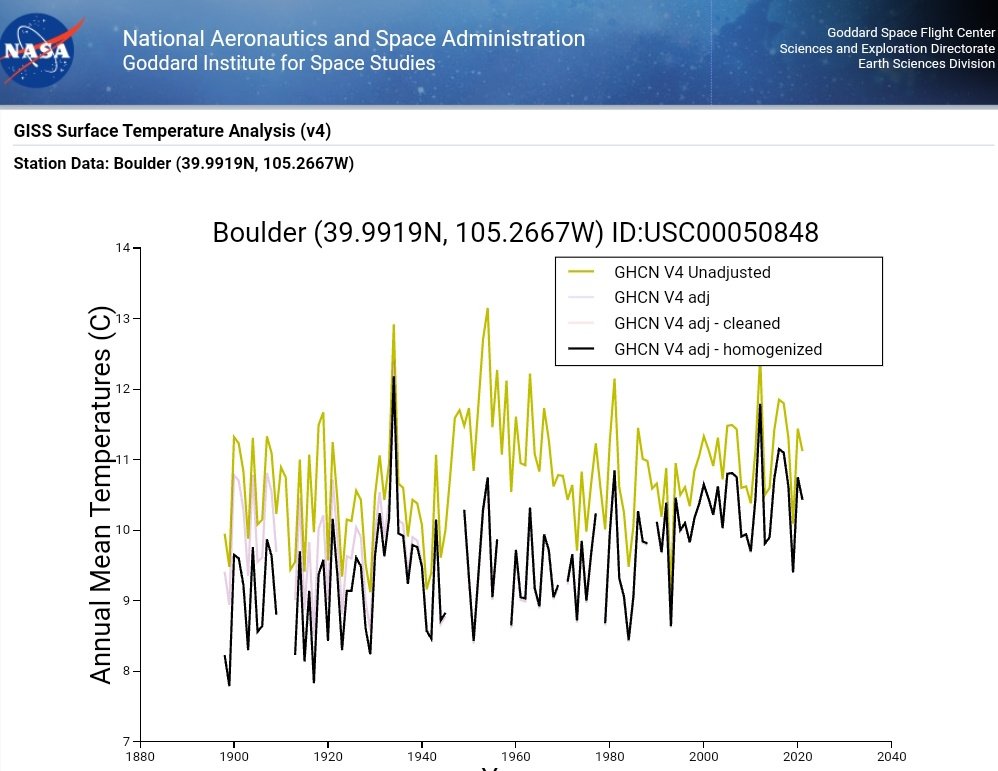
Boulder, Colorado, US: cooling the past and removing the mid-20thC warm period. Recent warming is UHI effect (BI 37).
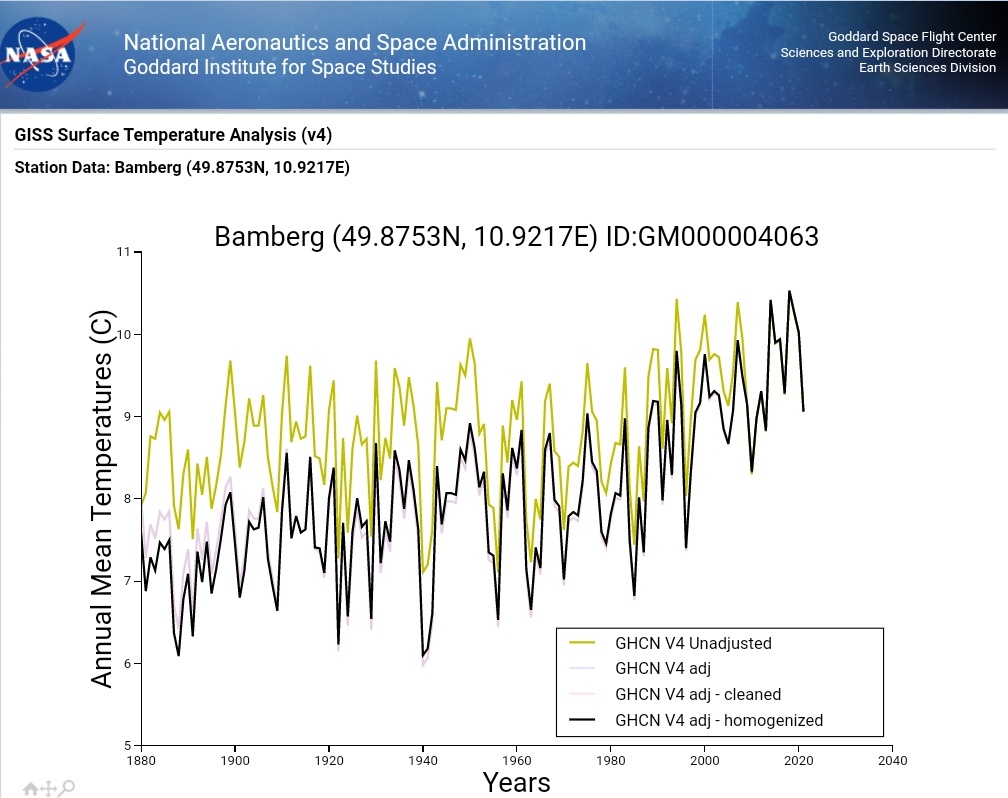
Gradually cooling the past to create a steeper warming trend in Bamberg, Germany.
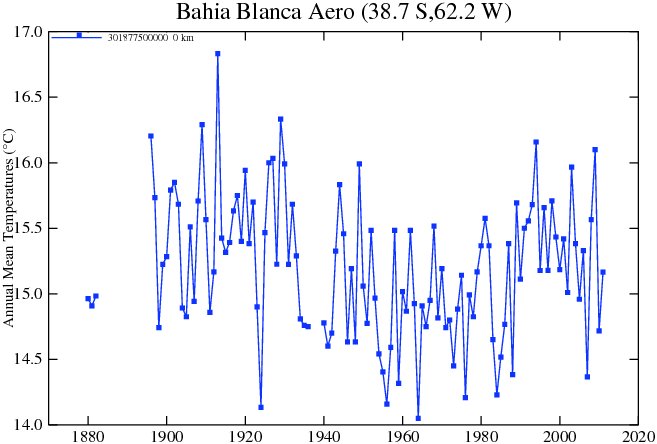
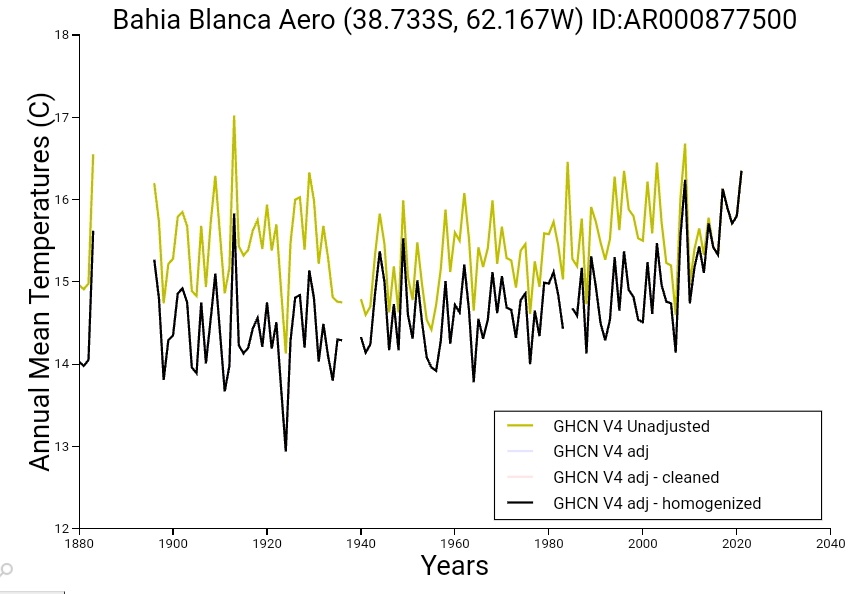
Manufactured warming at Bahia Blanca Aero, Argentina.
NASA GISS v2 (2011) vs v4
NASA GISS v2 (2011) vs v4
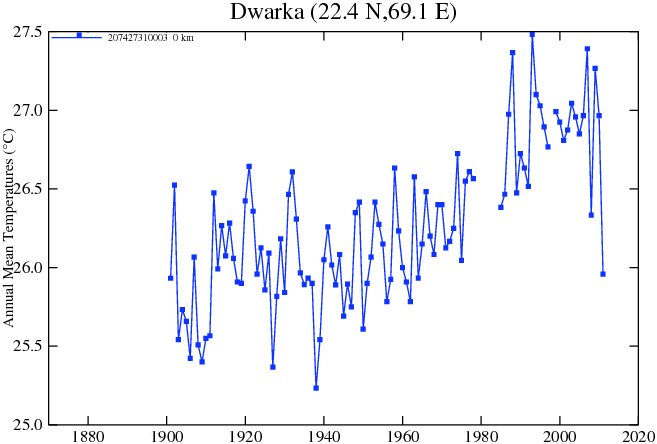
Dwark, India (BI 0 = no UHI effect).
Heavy adjustments that cool the past, remove multi-decadal variability and create a steep warming trend.
NASA GISS v2 (2011) and v4 (current)
Heavy adjustments that cool the past, remove multi-decadal variability and create a steep warming trend.
NASA GISS v2 (2011) and v4 (current)

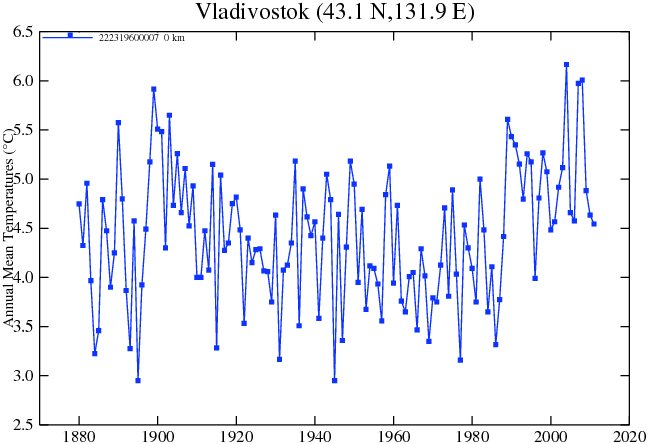
Cooling the past in Vladivostok, Russia.
GISS v2 (2011) and v4 (current):
GISS v2 (2011) and v4 (current):

• • •
Missing some Tweet in this thread? You can try to
force a refresh