
As Promised we will be sharing some Chrome Extensions for #Zerodha users that can help them in their Trading Immensely.
If this list helps. We would highly appreciate a Retweet and Like to further maximise the tweet reach❤️
Let's go!
If this list helps. We would highly appreciate a Retweet and Like to further maximise the tweet reach❤️
Let's go!
1. Zerodha Scrip Plus 😎
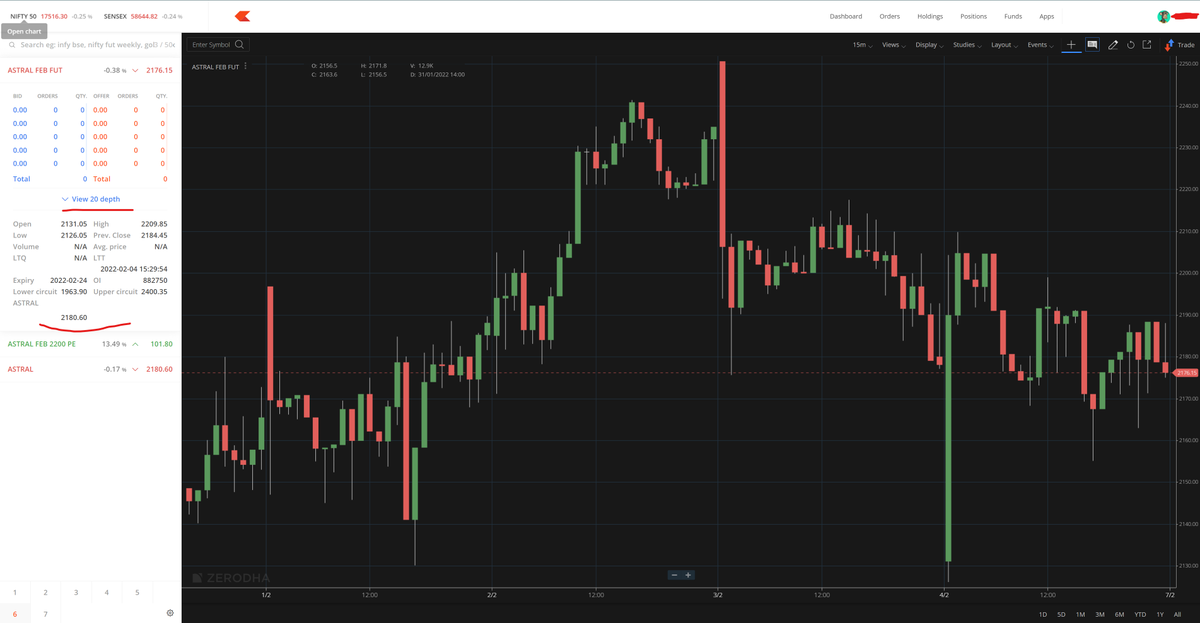
This extension adds a variety of cool features.
⚡️It stretches the #Zerodha Interface Full-Width.
⚡️It makes the text appear bold in Market Depth.
⚡️It automatically calculates your brokerage & taxes and displays them right above your orders Live.❤️
This extension adds a variety of cool features.
⚡️It stretches the #Zerodha Interface Full-Width.
⚡️It makes the text appear bold in Market Depth.
⚡️It automatically calculates your brokerage & taxes and displays them right above your orders Live.❤️
2. Jarvis 🦾
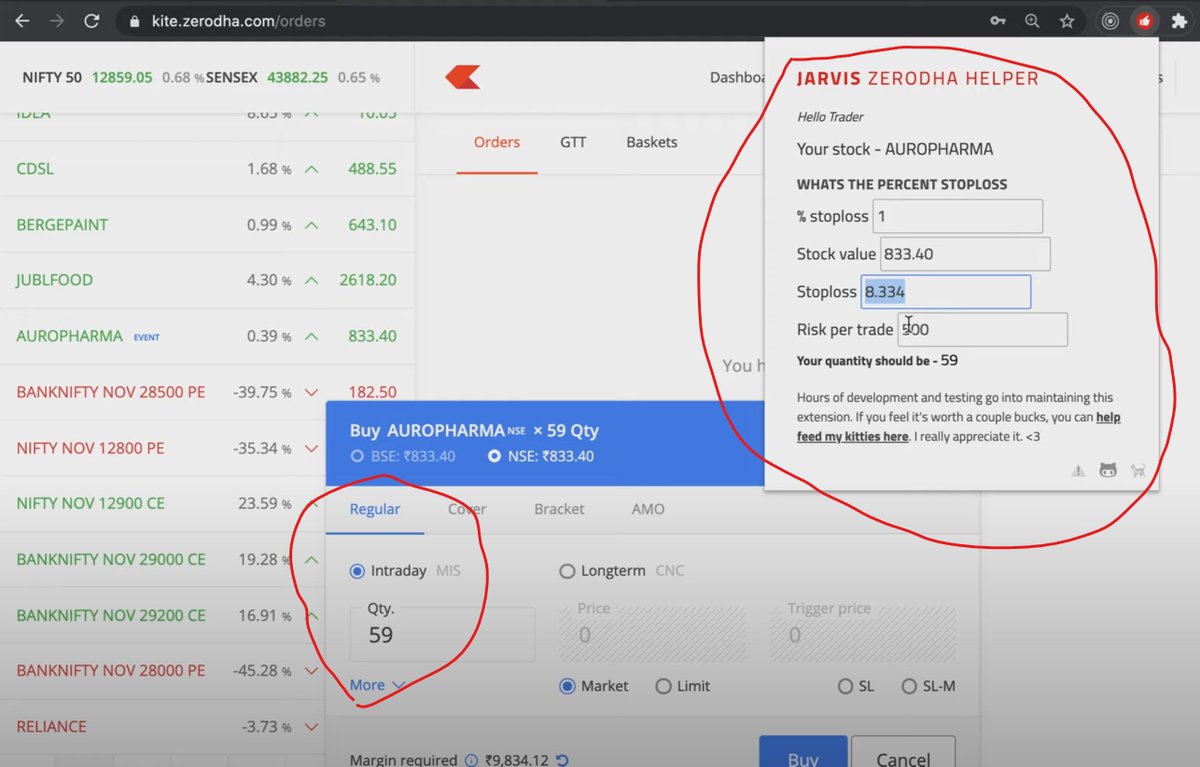
⚡️This extension makes it easy to calculate the quantity that you guys can take according to the risk mentioned.
⚡️It auto fills the quantity to the #zerodha order window once you have defined your risk.
So the lazy traders out there or newbie traders use this!
⚡️This extension makes it easy to calculate the quantity that you guys can take according to the risk mentioned.
⚡️It auto fills the quantity to the #zerodha order window once you have defined your risk.
So the lazy traders out there or newbie traders use this!
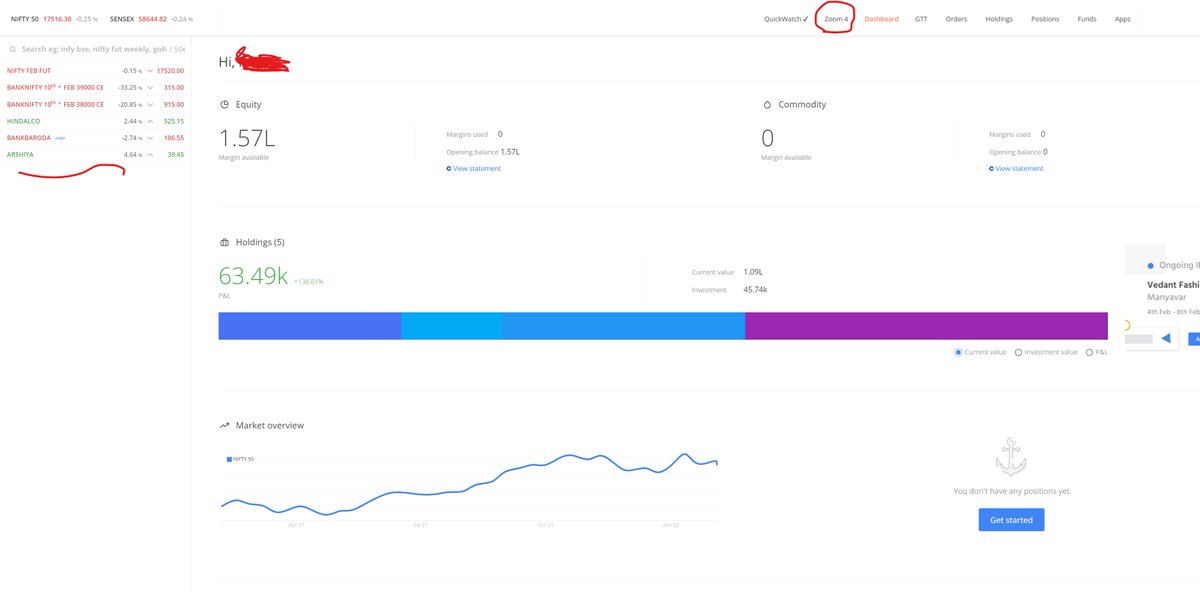
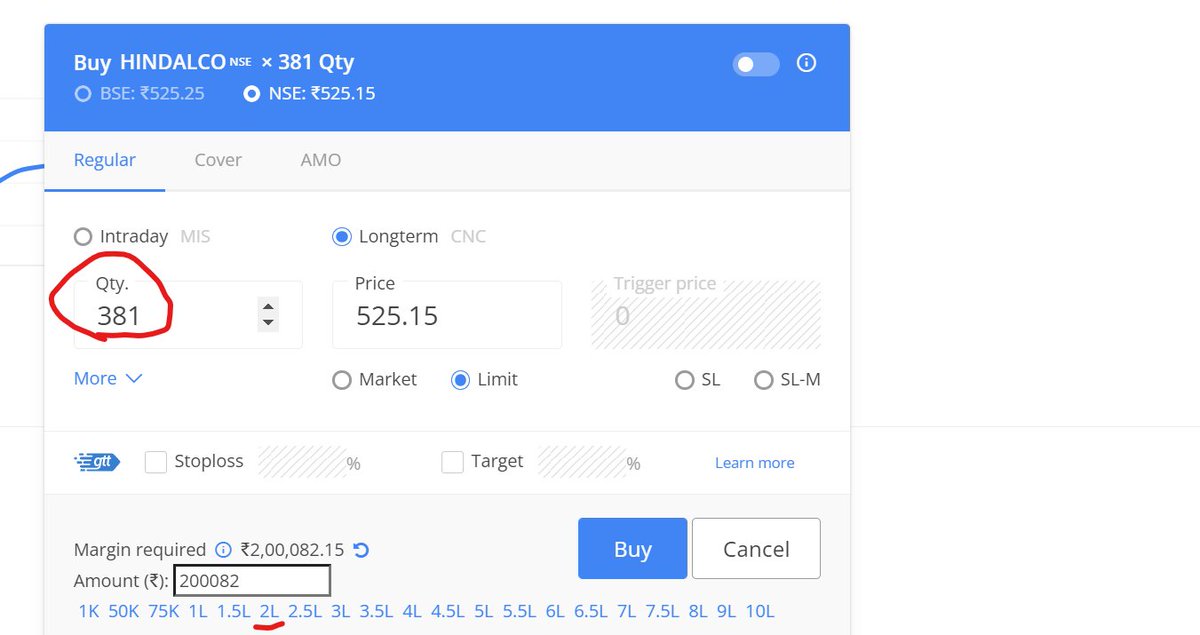
3.Zerodha Kite Enhancements 👻
⚡️It auto calculates and auto fills the quantity you can buy just by clicking on the amounts below.
⚡️It adds a hide quickwatch button for real full width access
⚡️It has 4 levels of zoom for watch list. So you can glance at more data.
Try it!
⚡️It auto calculates and auto fills the quantity you can buy just by clicking on the amounts below.
⚡️It adds a hide quickwatch button for real full width access
⚡️It has 4 levels of zoom for watch list. So you can glance at more data.
Try it!

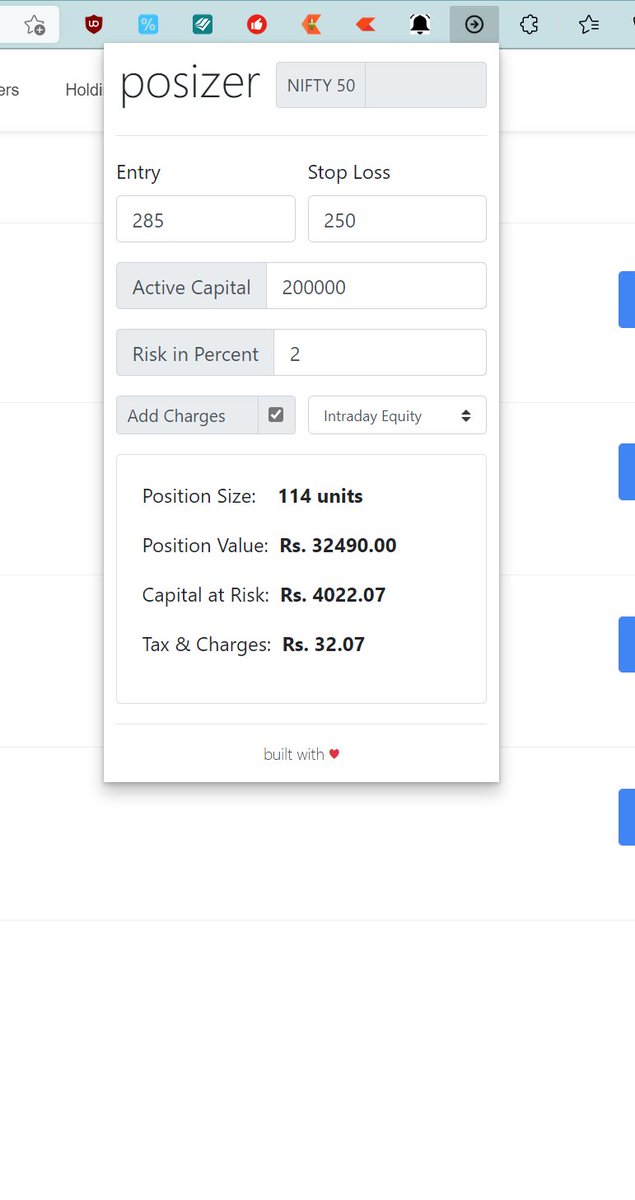
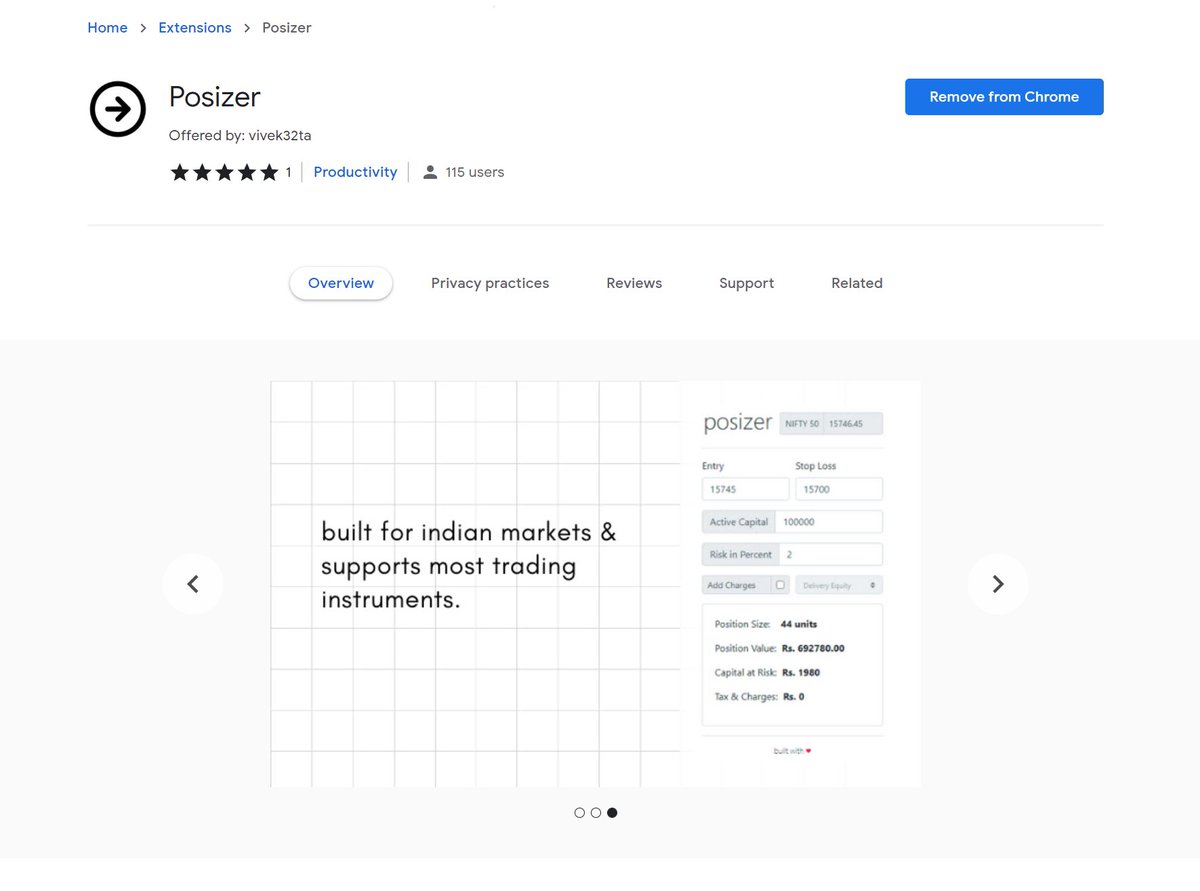
4. Posizer 👏
⚡️A Clean tool again to calculate how much quantity you should take according to your risk appetite.
⚡️Auto calculates brokerage charges according to CASH, FNO etc.
Handy tool for newbie traders! Isn't it?
⚡️A Clean tool again to calculate how much quantity you should take according to your risk appetite.
⚡️Auto calculates brokerage charges according to CASH, FNO etc.
Handy tool for newbie traders! Isn't it?
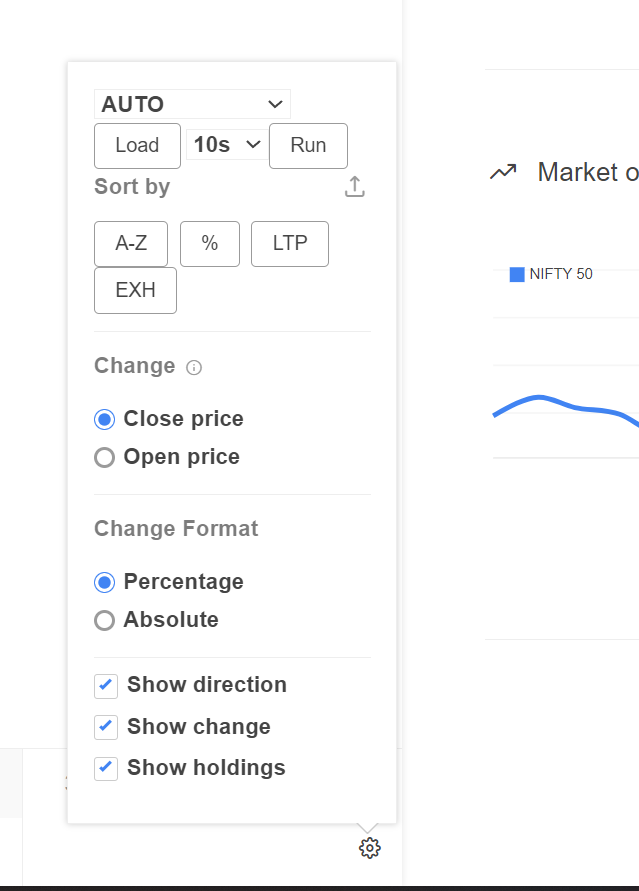
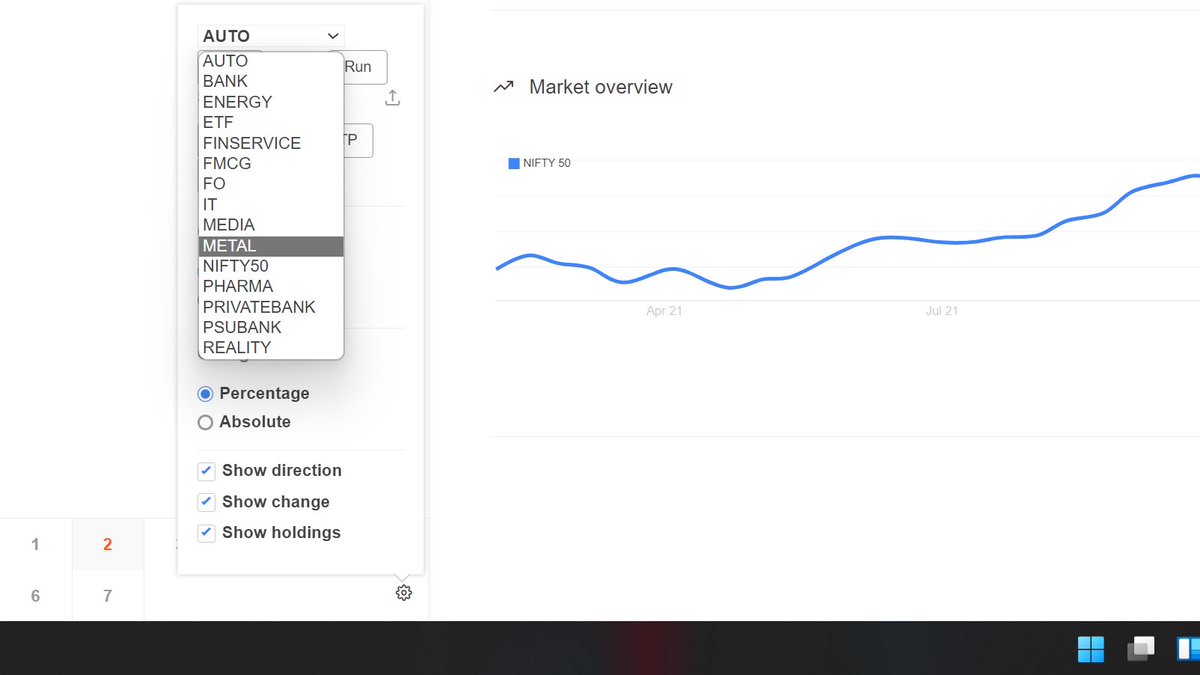
5. Cyborg 😱
⚡️View the most volatile stocks over the last 10seconds, 1minute or 1hour etc in #zerodha kite
⚡️Sort the stocks in current marketwatch by volatility.
⚡️Load market watch with list of different index stocks.
Try it in Live Market!
⚡️View the most volatile stocks over the last 10seconds, 1minute or 1hour etc in #zerodha kite
⚡️Sort the stocks in current marketwatch by volatility.
⚡️Load market watch with list of different index stocks.
Try it in Live Market!

Links to download:
1. Zerodha Scrip Plus
chrome.google.com/webstore/detai…
2.Jarvis
chrome.google.com/webstore/detai…
3.Kite Enhancements
chrome.google.com/webstore/detai…
4.Posizer
chrome.google.com/webstore/detai…
5.Cyborg
chrome.google.com/webstore/detai…
Please Retweet for wider reach and Help traders out there! ❤️
Join Us | t.me/chartians
Fall in love with Charts. We post some of the cleanest charts in the Market and share our trading ideas with the public for free!
Fall in love with Charts. We post some of the cleanest charts in the Market and share our trading ideas with the public for free!
• • •
Missing some Tweet in this thread? You can try to
force a refresh


