
📣 (warning: long thread w/50+ graphics)
It's been another 3 months, so I figured it's a good time to again break out COVID county-level, 2-dose, total population vaccination rates for all 50 states.
Again, I use CDC data for most states, w/state health dept. data for a few. 1/
It's been another 3 months, so I figured it's a good time to again break out COVID county-level, 2-dose, total population vaccination rates for all 50 states.
Again, I use CDC data for most states, w/state health dept. data for a few. 1/
ALABAMA: Fairly weak partisan correlation, mainly because the vaccination rate sucks pretty much EVERYWHERE. It does form an odd snake shape, though.
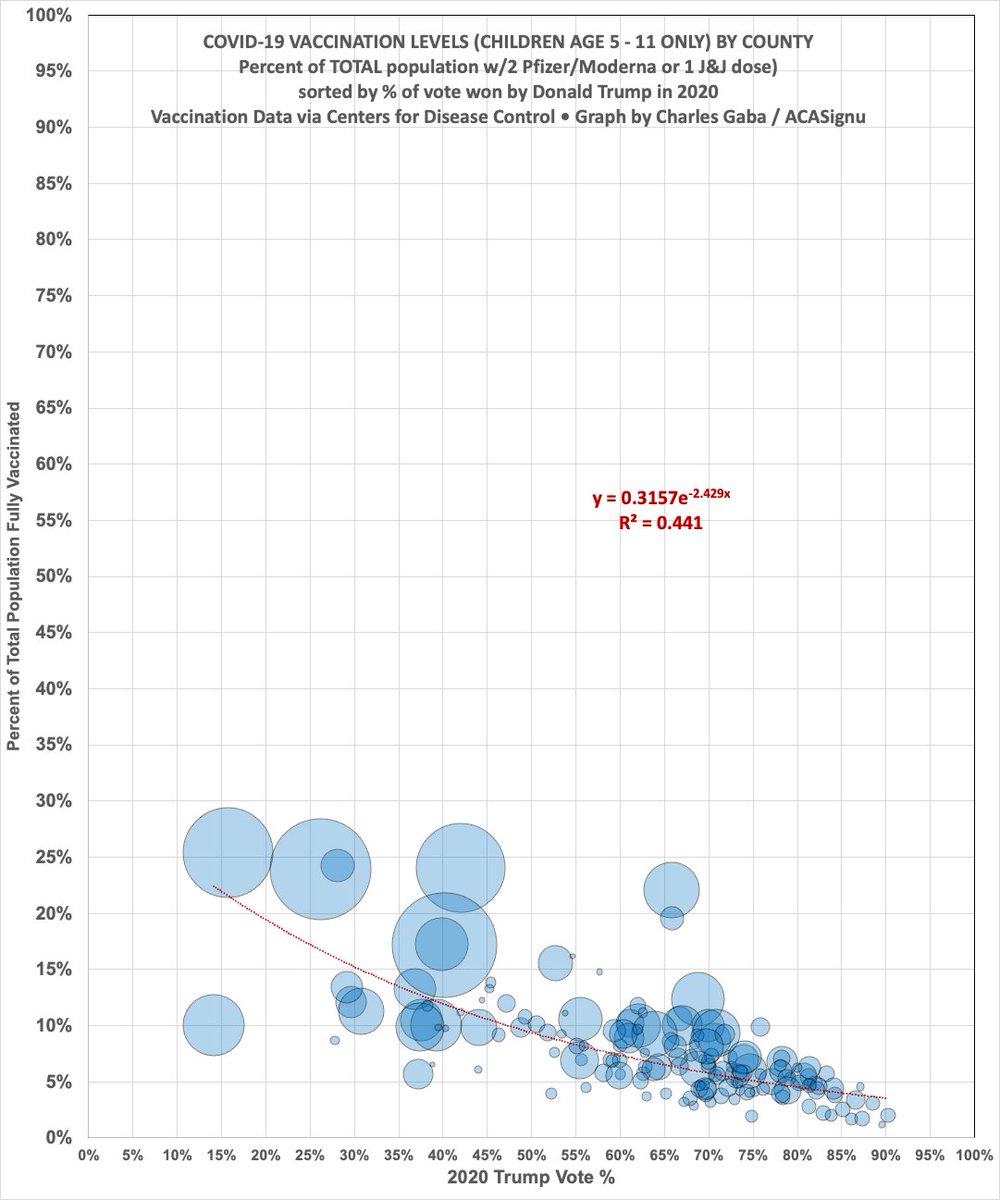
The graph on the right (w/out background graphics/etc) includes children 5-11 only.
The graph on the right (w/out background graphics/etc) includes children 5-11 only.


ALASKA: AK has always been all over the place on COVID vaccination rates. Bristol Bay has supposedly vaxxed *over* 100% of its population which is impossible; this is caused by a variety of factors including error margin etc. I've set a max cap of 98% for any county's vaxx rate.


ARIZONA: A pretty strong correlation..but this is a case where the CDC's data is completely at odds w/@AZDHS data, which claims that both Apache & Najavo Counties (which CDC puts at nearly 100% vaxxed) are only around ~48% vaxxed apiece. Possible data overlap w/Navajo Nation??


ARKANSAS: Again, very little slope or correlation; again, this is because nearly *every* county is doing terribly at this point (Over a year in, any w/less than 60% of their total population 2-dose vaxxed is doing pretty poorly IMHO).


CALIFORNIA: The Big One, in more ways than one. A rather stunning slope & correlation...the R^2 is nearly 0.73.
This is also the only state I've completed the 5-11 yr old version for...and it shows nearly the same pattern. Sad.
This is also the only state I've completed the 5-11 yr old version for...and it shows nearly the same pattern. Sad.


COLORADO: Stunning. An even *stronger* R^2 correlation, over .076.


CT, DE, DC, HI, RI: None of them have more than a handful of counties, making a scatter plot kind of pointless, so I lump them together just for completeness. I've made a "no county is 100% vaxxed" exception for Kalawao County, HI which has only 82 residents, all of whom are 50+.


FLORIDA: Decent correlation, & the 5-11 yr old graph is just sad. Big outliers: Sumter County (makes sense since it's home of The Villages, the huge MAGA retirement community)...and Miami-Dade County, which I still believe is MASSIVELY overstating their vaxx rate.


GEORGIA. Like other Southern/Deep South states, Georgia has a fairly mild slope...again, mostly because the vaxx rate is poor in nearly *every* county.

IDAHO. I've heard conflicting feedback from different statisticians: Some say an R^2 isn't significant unless it's over 0.6 or so. Others say that when *both* the X *and* Y axes are based on *individual human decisions*, it's significant at a far lower level.
Idaho is 0.61 FWIW.
Idaho is 0.61 FWIW.


ILLINOIS. Looking at the 2nd graph, all I can think is that Illinois Republicans must really hate their children.


INDIANA. (also per request by @greg_travis).


OK, I'm taking a breather for a bit; I'll continue the thread soon.
Meanwhile, if you want to support my work, you can do so here, thanks! acasignups.net/support
Meanwhile, if you want to support my work, you can do so here, thanks! acasignups.net/support
Update: Unfortunately I’m having some technical issues which will delay the rest of this series. Stay tuned…
OK, here's part 2...for technical reasons I'm only posting the "full population" graphs for now. Hope to get the 5-11 yr old versions ready soon.
IOWA:
IOWA:

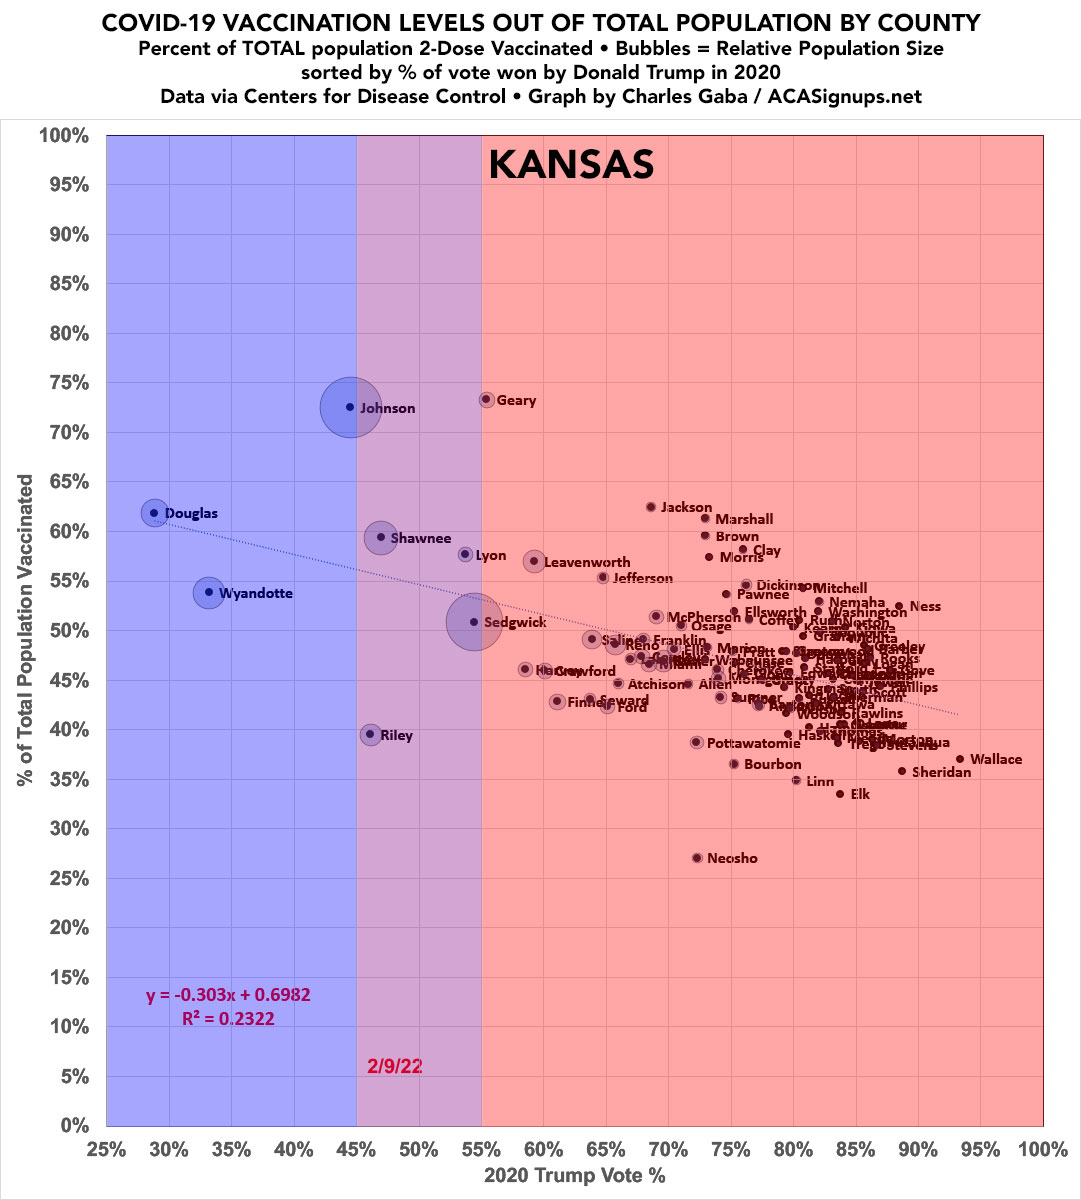
KANSAS:
KENTUCKY:

LOUISIANA. I still have no idea what the deal is with West Feliciana Parish, other than the LA State Penitentiary being located there.

MAINE. Yes, you're reading the R^2 correctly: Nearly 0.8.

MARYLAND:

MASSACHUSETTS. Both Dukes & Nantucket are supposedly *over* 100% 2-dose vaxxed; obviously that can't be the case. They're capped at 98%.

MICHIGAN, my home state.

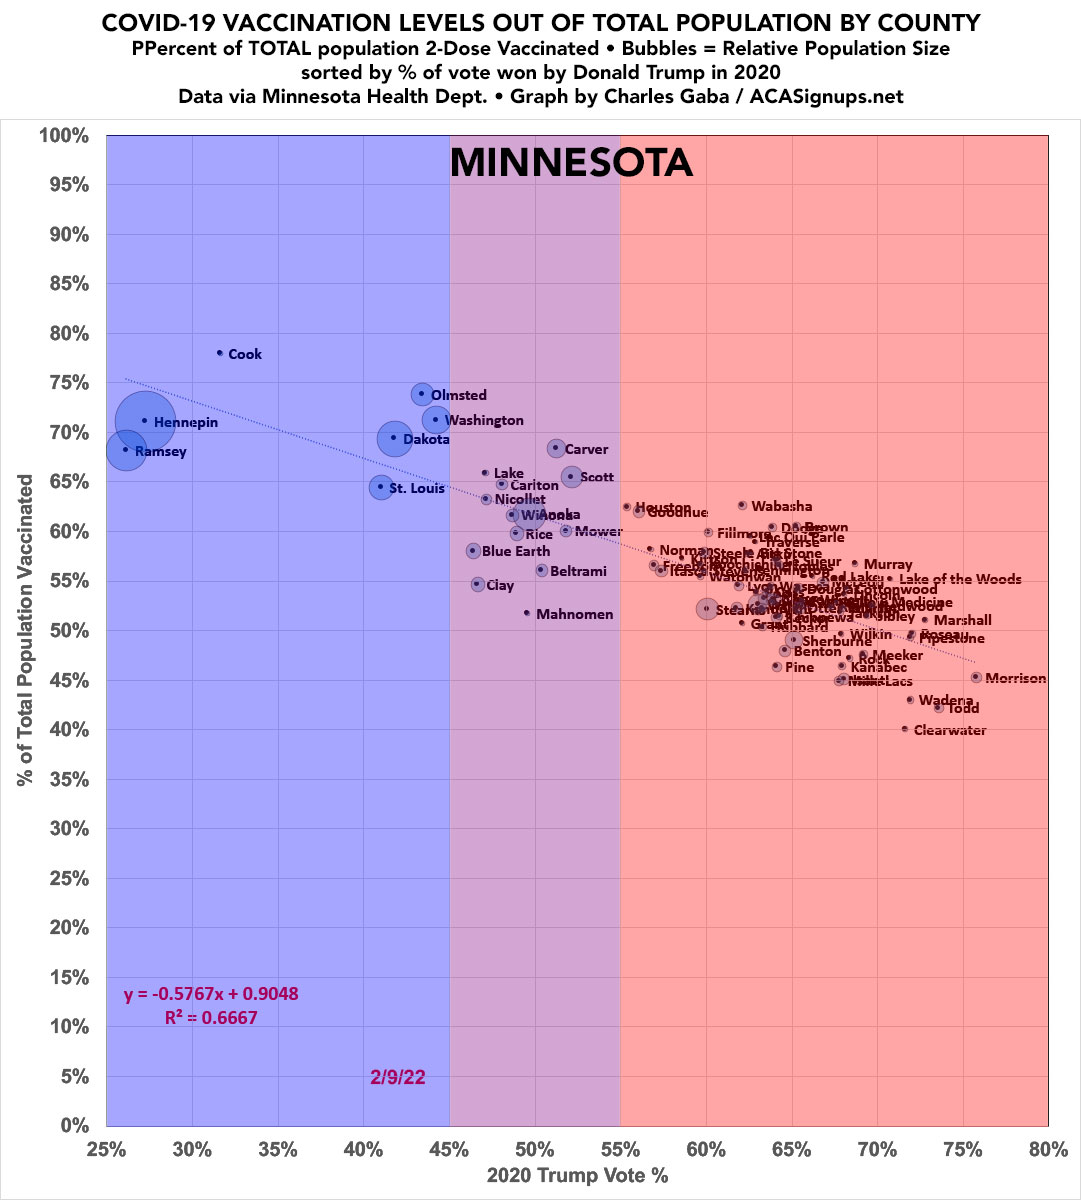
MINNESOTA.
MISSISSIPPI.
COVID-19 has killed 1 out of every 259 Mississippians to date.
COVID-19 has killed 1 out of every 259 Mississippians to date.

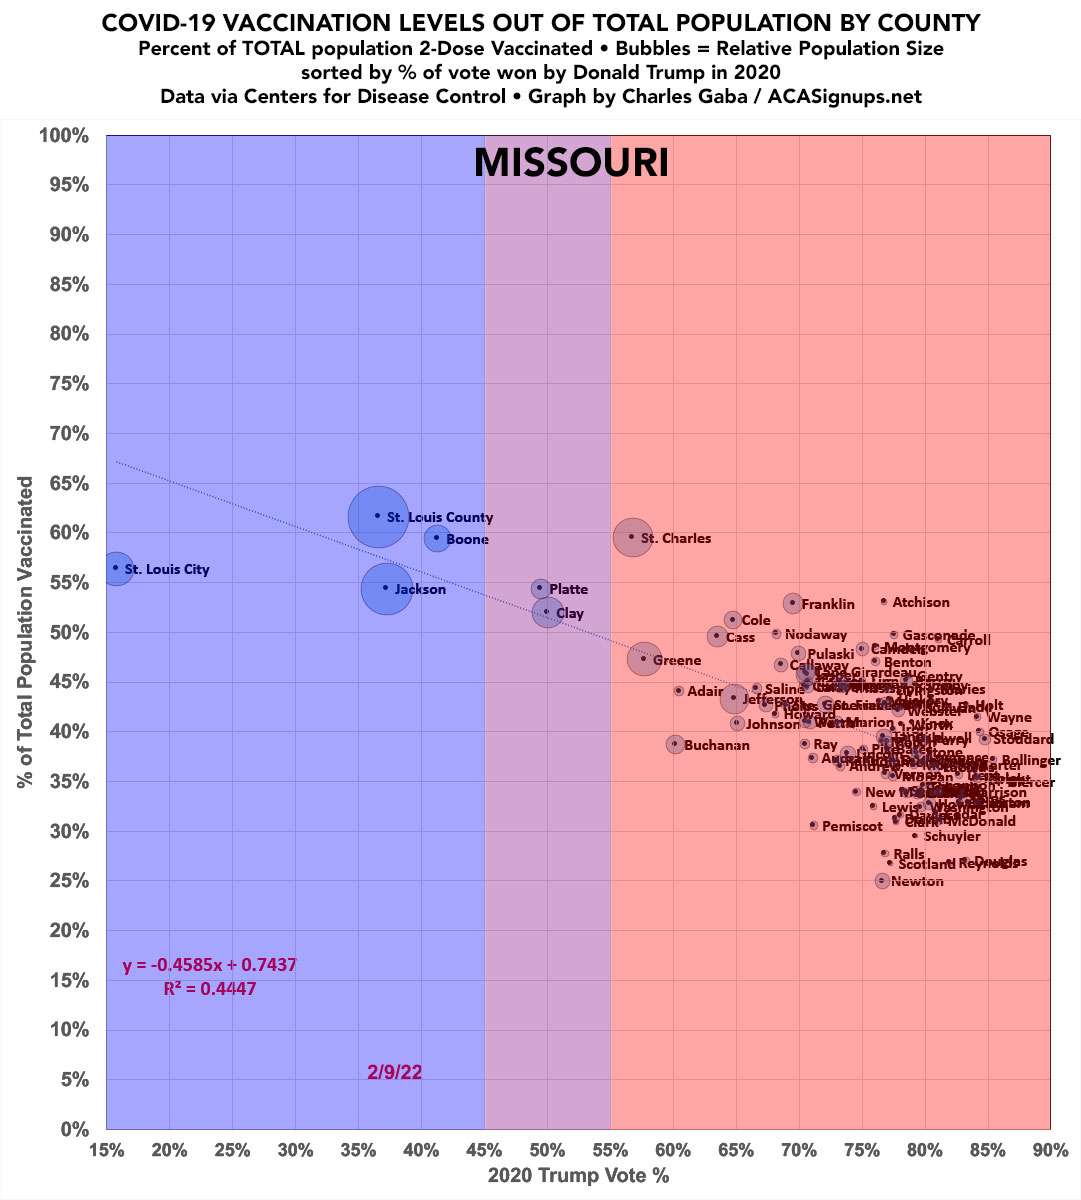
MISSOURI.
MONTANA.

NEBRASKA.

NEVADA.

NEW HAMPSHIRE.

NEW JERSEY.

NEW MEXICO. Yes, the R^2 is 0.77.

NEW YORK.

NORTH CAROLINA.

NORTH DAKOTA.

OHIO.

OKLAHOMA.

OREGON. R^2: 0.772

PENNSYLVANIA.

SOUTH CAROLINA.

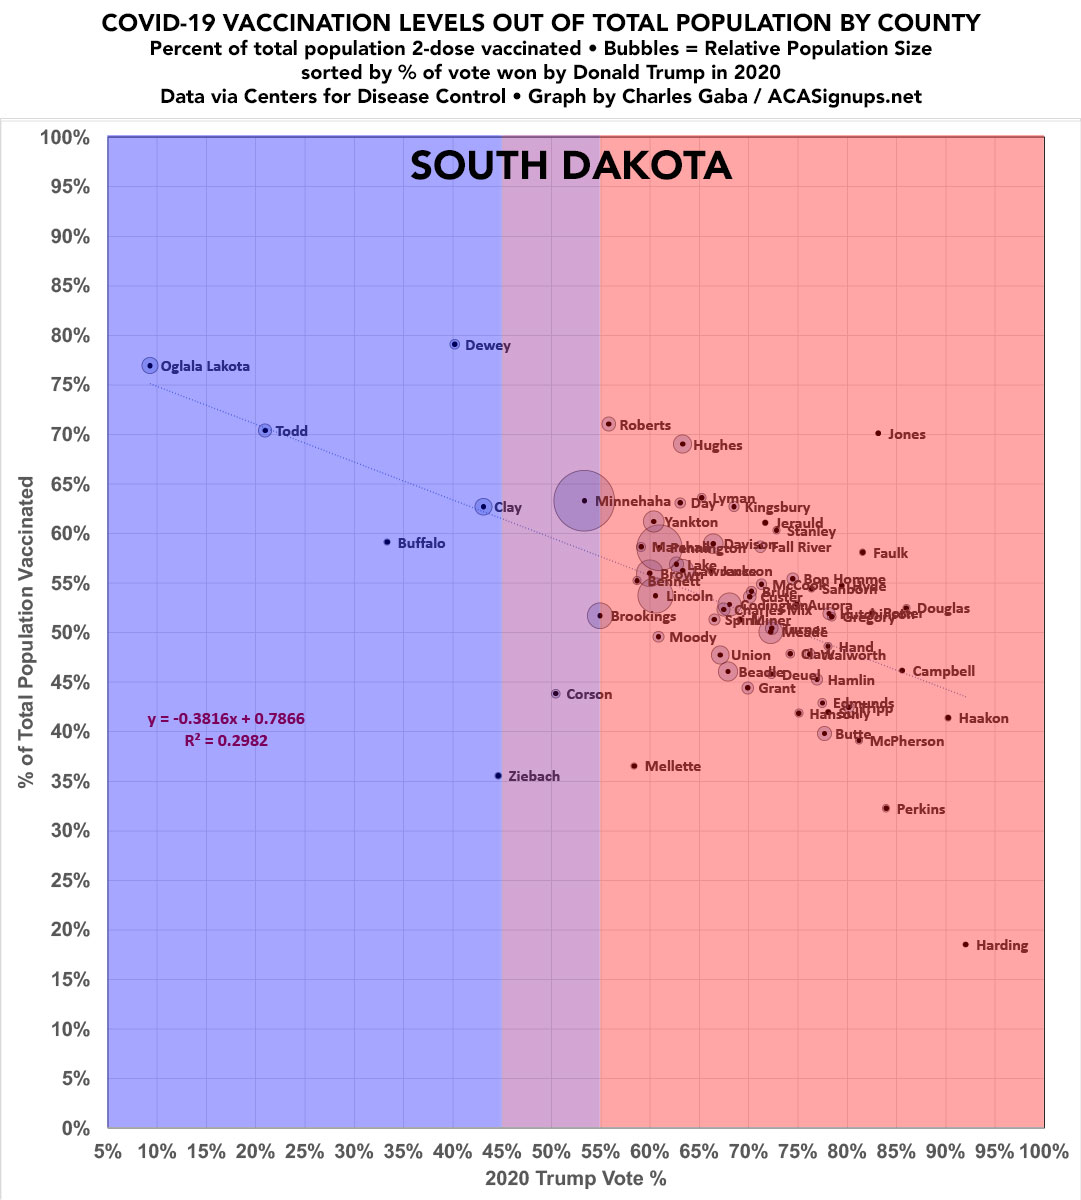
SOUTH DAKOTA.
TENNESSEE.

TEXAS.

UTAH.

VERMONT.

VIRGINIA (warning: The CDC's vaxx data for Virginia is kind of strange, but the state health dept. dashboard doesn't allow for easy county-level export, so be forewarned).

WASHINGTON STATE:

WEST VIRGINIA:

WISCONSIN.

AND FINALLY...WYOMING.
And yes, the R-squared below is 0.8673.
And yes, the R-squared below is 0.8673.

Whew! There you have it: All 50 states, plus DC.
I hope to break out 5-11 yr olds soon (as well as only counting those < 65, since seniors tended to get vaxxed across the board last year).
If you'd like to support my work, you can do so here, thanks!
acasignups.net/support
I hope to break out 5-11 yr olds soon (as well as only counting those < 65, since seniors tended to get vaxxed across the board last year).
If you'd like to support my work, you can do so here, thanks!
acasignups.net/support
• • •
Missing some Tweet in this thread? You can try to
force a refresh


