If you think corporate greed is playing a major role in the current inflation then you need to rethink a lot of your views.
1. FISCAL MULTIPLIERS. Fiscal stimulus is less effective than you thought because it will go more into prices/profits than quantities.
2. INCIDENCE ANALYSIS OF FISCAL TRANSFERS. Distributional tables that show the stimulus checks going to households, for example, not correctly reflect that much of the benefit of the stimulus checks was captured by higher prices instead of higher purchasing power.
3. WORKER POWER AND REAL WAGES. If stronger demand raised the ability of corporations to do unfair or unjustified price increases over and above their costs then the flip side is you are saying that heating the economy lowers real wages.
(All of the above assumed that corporate greed was increased by high demand relative to supply, if it was just an exogenous increase in corporate greed—companies that could have done this in 2019 but mistakenly didn’t—the points would be slightly different.)
Oh, and I’m not updating my views on these topics because I think inflation is the result of demand and supply imbalances not changes in corporate greed.
• • •
Missing some Tweet in this thread? You can try to
force a refresh
Core PCE inflation came in just as expected. It has been very tame for the last three months--but shouldn't think of them in isolation but as part of a noisy process where inflation was much higher before.
And in big inflation news, the CPI-based Ecumenical Underlying Inflation measure was exactly 2.0% in May, consistent with the Fed's target. This is the first time it has been there since I started this concept during the inflationary episode.
The ecumenical measure takes the median of 21 different measures: 7 different concepts (e.g., with and without housing) over 3, 6 and 12 months--all re-meaned to match the PCE inflation that the Fed targets.
In practice it is very similar to 6-month core CPI (re-meaned).
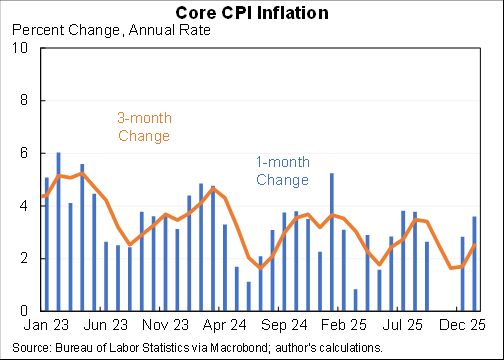
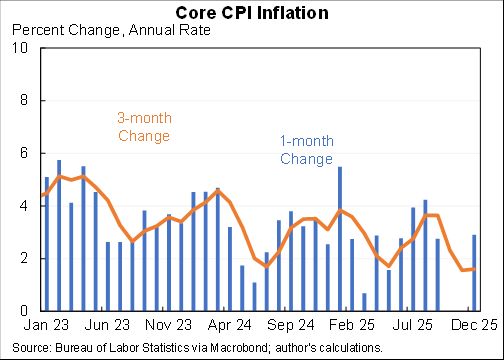
I didn't share the basic data earlier. Here is core CPI, came in well below expectations in May.
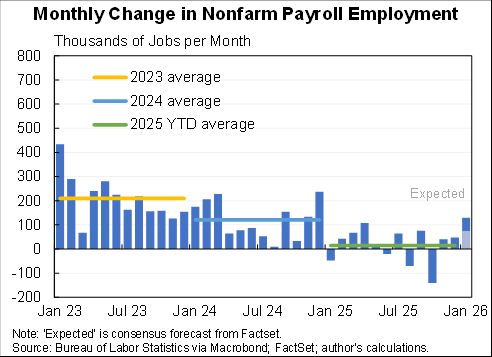
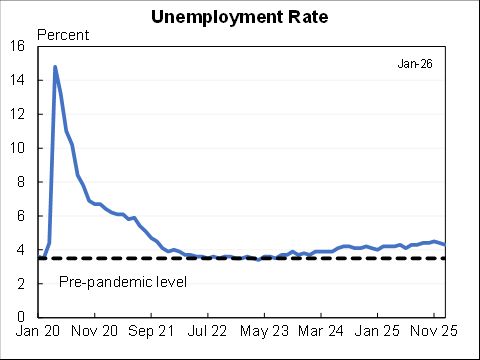
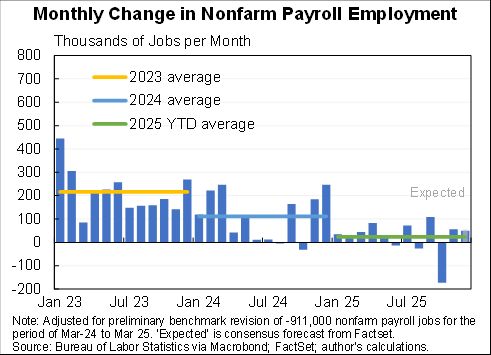
A boring jobs report, in a good way. 139K jobs added (140K private). Unemployment rate unchanged at 4.2%. Hours unchanged. Only notable deviations from steady state were participation down and unusual wage growth up.
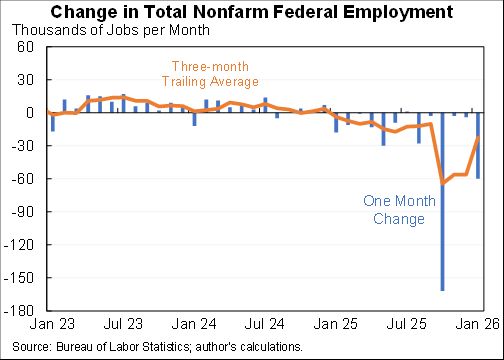
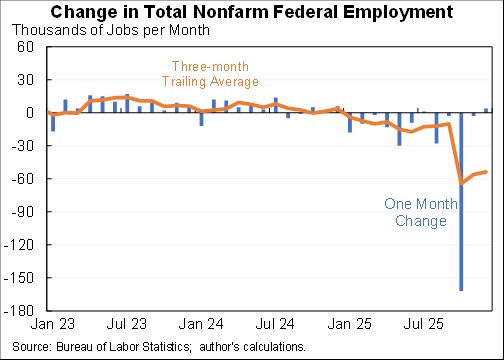
Note, Federal employment continued to decline. But state and local added almost as much.
Strong jobs report. 177K jobs added. Unemployment rate steady at 4.2% but participation rate up and U-6 down. Hours steady. A slowdown in hourly wage growth.
Federal employment was down a bit but state and local more than made up for it. The trend in private jobs is basically the same as total.
Unemployment rate very slowly drifted up for the last year and a half.
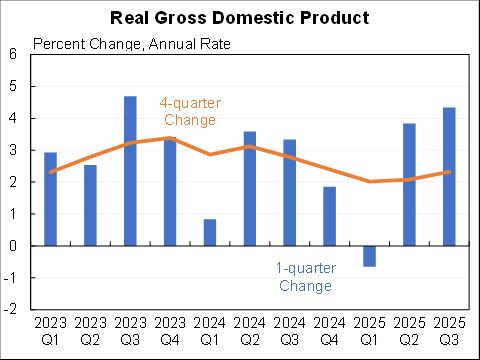
Wednesday's Q1 GDP # will have a lot of economic noise, a lot of measurement noise, and could generate even more political noise.
A technical🧵on one aspect: what period does it reflect?
The answer is a combo of pre- and post- 1/20 because of the weirdness of quarterly averages
When I (and most people) look at things like CPI or jobs, we look at something like a three month average. That would be growth from Dec 2024 to Mar 2025. Which is also the (geometric) average of the growth rates in Jan, Feb and Mar. It tells you what happened in those 3 months.
But GDP is not reported monthly (fortunately, would be really volatile). So the numbers are the growth from the average of Oct/Nov/Dec to Jan/Feb/Mar. If there is weak growth in Nov or Dec that lowers part of Q4 but all of Q1 so lowers overall growth.