
You're always trading around volatility, such as from earnings reports (ER).
In the @unusual_whales flow and on its alerts, there are a couple of emojis to denote an upcoming ER:
⌛ - ER within 14 days
🦄 - ER w/in a week
There is a lot more to volatility than just ERs, though:
In the @unusual_whales flow and on its alerts, there are a couple of emojis to denote an upcoming ER:
⌛ - ER within 14 days
🦄 - ER w/in a week
There is a lot more to volatility than just ERs, though:

Implied volatility (IV) is a measurement of volatility.
It is one of the measurements used to price options contracts and as an indication of how much (in *EITHER DIRECTION*) a stock could move in the future.
As pricing changes in real-time, so too does IV.
It is one of the measurements used to price options contracts and as an indication of how much (in *EITHER DIRECTION*) a stock could move in the future.
As pricing changes in real-time, so too does IV.
By the way, you can see a ticker's IV in the @unusual_whales flow by going to "Table Settings" and toggling it on (pictured).

IV tends to increase as stocks trend lower; however, IV is *NEVER* an indication of direction.
IV, of course, is *implied* volatility, so we can consider it as a kind of "assumption" (an implication) being made on the potential move of the stock.
IV, of course, is *implied* volatility, so we can consider it as a kind of "assumption" (an implication) being made on the potential move of the stock.
These measurements are laid out to us in a variety of ways:
Example 1/ In ThinkOrSwim there is a measurement called the MMM at the top, which measures this similarly, to show you an expected move which is quite useful (especially into earnings reports).
Example 1/ In ThinkOrSwim there is a measurement called the MMM at the top, which measures this similarly, to show you an expected move which is quite useful (especially into earnings reports).
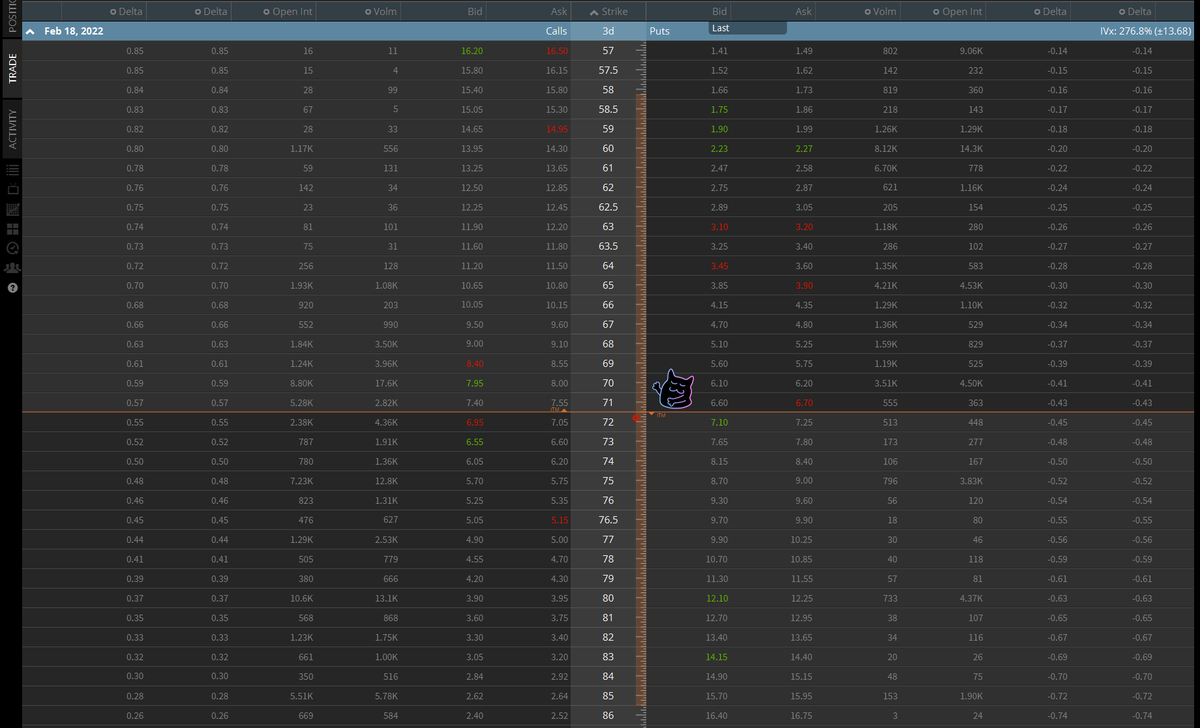
Example 2/ In TastyTrade the strike bar in the middle is highlighted in a pale orange to show you the potential move.
I put a cute little black cat dead center to call your attention to the vertical bar that is highlighted in the middle, depicting this potential move.
I put a cute little black cat dead center to call your attention to the vertical bar that is highlighted in the middle, depicting this potential move.
To investigate IV further, you can look at the @unusual_whales volatility skew, found on the intraday analyst page (unusualwhales.com/flow/ticker/ov…)
Here is $RBLX as an example (with it trading around $71.39 at the time of this post).
Here is $RBLX as an example (with it trading around $71.39 at the time of this post).
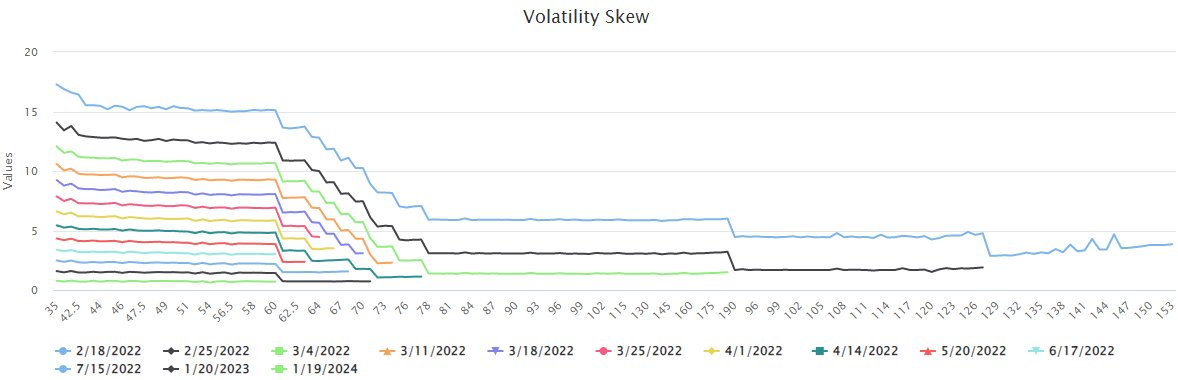
The strike prices are along the horizontal axis and implied volatility (IV) is along the vertical axis. Each expiration is notated by a color, with a legend below the chart.
This kind of volatility skew shows there is more IV at deeper ITM strikes and at the closer expirations.
This kind of volatility skew shows there is more IV at deeper ITM strikes and at the closer expirations.
This type of skew is called a “smirk” and is expected with an upcoming catalyst, such as $RBLX's inclement ER in this example. There would be greater speculation and more volatility with such a catalyst on the horizon.
*IV does not give any semblance of direction!*
Please note:
*IV does not give any semblance of direction!*
Please note:
- When IV is higher, premiums are also higher.
- You are paying more because there is a higher chance of a significant move (*in either direction*), so you therefore pay for that right to bet on such a movement.
- Therefore, betting upon high IV stocks carries additional risks.
- You are paying more because there is a higher chance of a significant move (*in either direction*), so you therefore pay for that right to bet on such a movement.
- Therefore, betting upon high IV stocks carries additional risks.
So this is all well and good, but how do you trade IV?
First and foremost, please reconsider trading high IV stocks at all until you have conducted your full due diligence. (Goes without saying!)
First and foremost, please reconsider trading high IV stocks at all until you have conducted your full due diligence. (Goes without saying!)
Some strategies such as calendar and diagonal spreads take advantage of volatility.
To build a calendar spread:
- Sell to open a closer dated OTM position.
- Then buy to open the same strike further out.
- View an example here in the @unusual_whales OPC: unusualwhales.com/shared_trade/1…
To build a calendar spread:
- Sell to open a closer dated OTM position.
- Then buy to open the same strike further out.
- View an example here in the @unusual_whales OPC: unusualwhales.com/shared_trade/1…
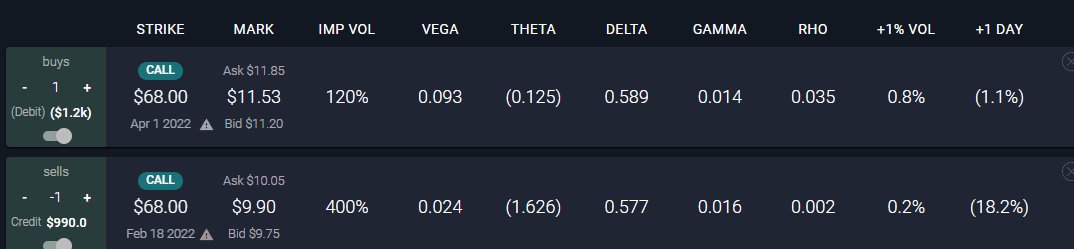
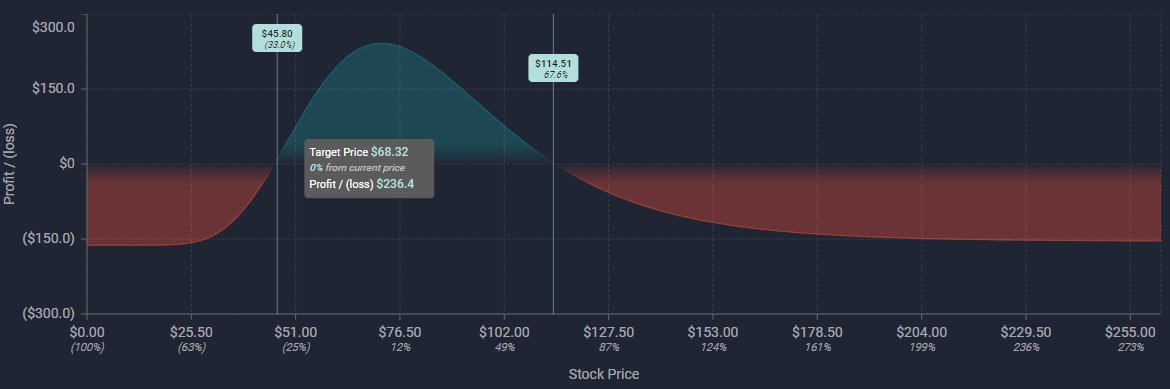
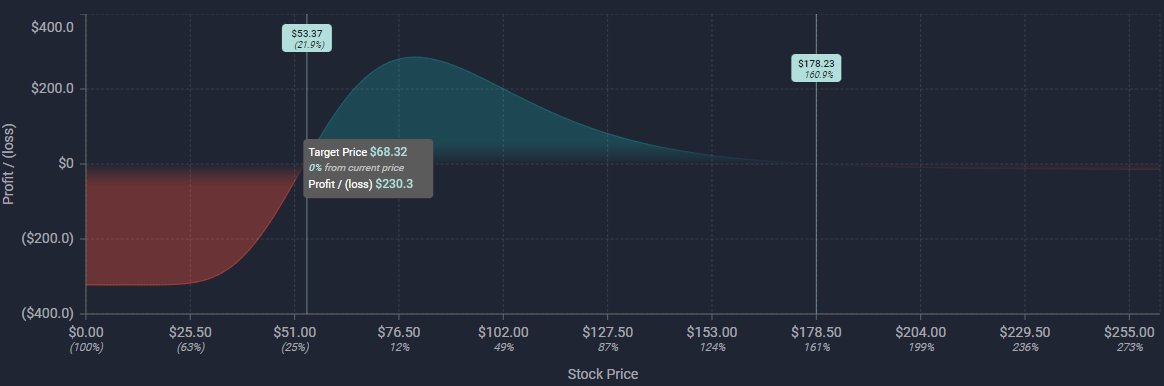
A diagonal spread:
- Is just the same as a calendar spread, but instead of the same strikes across two different expirations, the strikes are also different.
- As you can see in both, max. profit potential spikes up in the middle, and there is a "net" prior to exp. of the short.
- Is just the same as a calendar spread, but instead of the same strikes across two different expirations, the strikes are also different.
- As you can see in both, max. profit potential spikes up in the middle, and there is a "net" prior to exp. of the short.

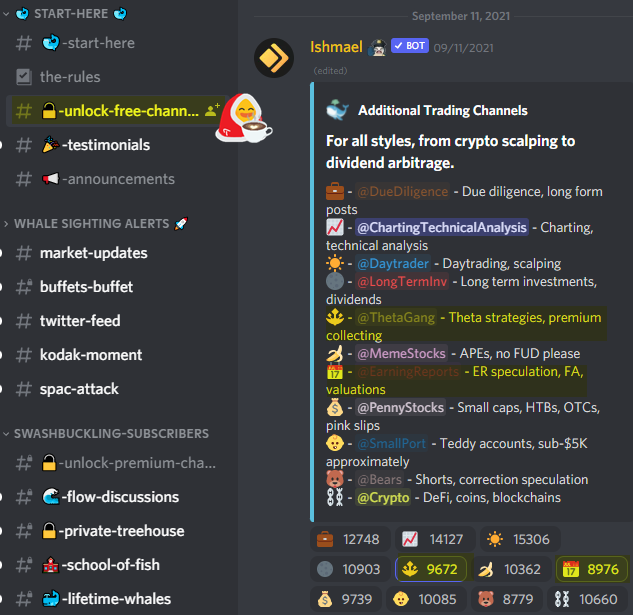
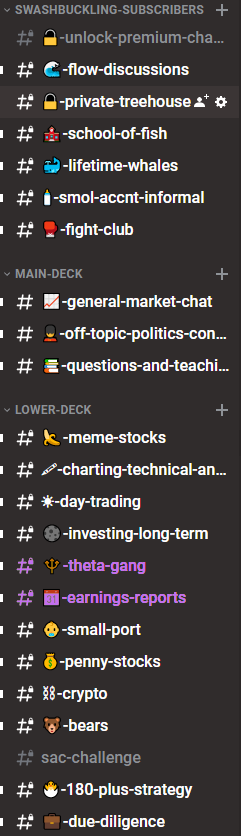
To learn more about these kinds of strategies, join the @unusual_whales Discord (discord.gg/unusualwhales):
- then go to 🔓-unlock-free-channels and opt into 🔱-theta-gang and 📆-earnings-reports where folks are taking advantage of IV!
(Highlighted the channels for you here!)
- then go to 🔓-unlock-free-channels and opt into 🔱-theta-gang and 📆-earnings-reports where folks are taking advantage of IV!
(Highlighted the channels for you here!)
So these are ways to start investigating and even trading IV, but where does IV go wrong--or how can it mess up our trades?
That's where "IV crush" comes in:
That's where "IV crush" comes in:
IV crush is a term used to explain the occurrence of rapidly decreasing IV after a catalyst, such as but not limited to earnings reports, company announcements, and FOMC meetings.
- IV increases more and more as the event date approaches. It rapidly declines after the event passes.
- This is the "crush"--as options' prices would be significantly higher as IV was increased due to the catalyst, and their prices would fall down after the event passed.
- This is the "crush"--as options' prices would be significantly higher as IV was increased due to the catalyst, and their prices would fall down after the event passed.
This is why trading around ER is so difficult, as there is so much speculation.
Once the selling transpires after ER is released, IV rapidly decreases as the catalyst is now "known" to the market and therefore options' pricings also decline.
Once the selling transpires after ER is released, IV rapidly decreases as the catalyst is now "known" to the market and therefore options' pricings also decline.
This has gotten a bit lengthy, as I reckon I am one to do, so I shall leave it here for now.
If you have questions, just ask. I am here to help, as always. And join the bloody Discord (discord.gg/unusualwhales)! It's where I learned everything (and then some).
If you have questions, just ask. I am here to help, as always. And join the bloody Discord (discord.gg/unusualwhales)! It's where I learned everything (and then some).
@threadreaderapp unroll
• • •
Missing some Tweet in this thread? You can try to
force a refresh


