
3 Ways to Ride the Complete Trend in a Stock
1. Supertrend
2. Moving Averages
3. Relative Strength
A Thread🧵 With Examples
Retweet Comment and Share :)
1. Supertrend
2. Moving Averages
3. Relative Strength
A Thread🧵 With Examples
Retweet Comment and Share :)
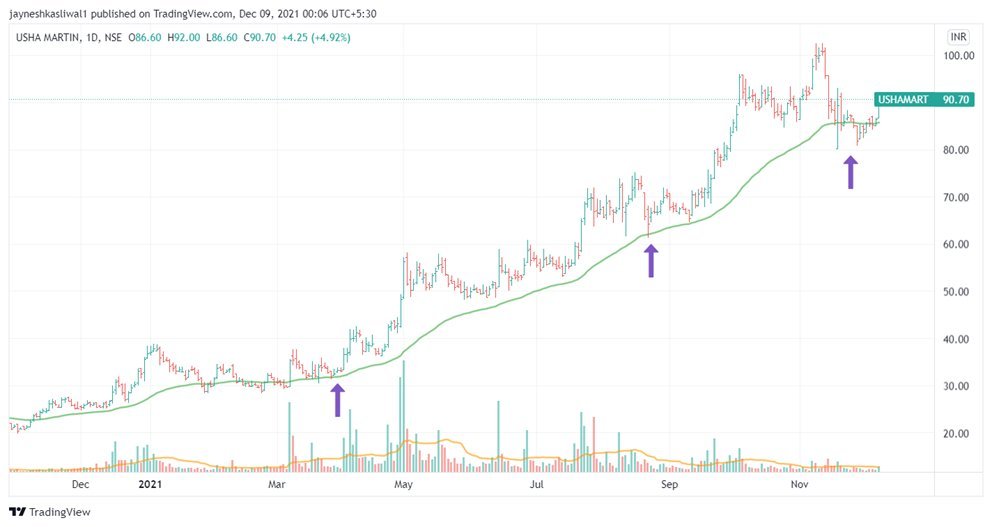
SuperTrend :
It is TrendFollowing Indicator That generates Buy / Sell signals based on the ATR value or volatility of the stock
Supertrend also works as a trailing stop-loss for the existing trades Best on daily time frame
2/n
It is TrendFollowing Indicator That generates Buy / Sell signals based on the ATR value or volatility of the stock
Supertrend also works as a trailing stop-loss for the existing trades Best on daily time frame
2/n

Supertrend Conditions
Works Best on 10 , 3 settings
One can try and backtest on 10 ,2 at own also !
Doesnt Work well in Sideways Zone as it is trend following indicator
3/n
Works Best on 10 , 3 settings
One can try and backtest on 10 ,2 at own also !
Doesnt Work well in Sideways Zone as it is trend following indicator
3/n

1. Works Best In trending Markets
2. Keep Riding the trend till Supertrend Turns Red
3. Use Price Action to Enter and Supertrend As Trailing Stoploss
4. Sometimes Gives Multiple Signals Where you can take Small Stoploss .
Example :
4/n
2. Keep Riding the trend till Supertrend Turns Red
3. Use Price Action to Enter and Supertrend As Trailing Stoploss
4. Sometimes Gives Multiple Signals Where you can take Small Stoploss .
Example :
4/n


Supertrend to be avoided in Sideways markets as it gives a lot of false Signals .
Use Normal Support Resistance as Stoploss in this case
5/n
Use Normal Support Resistance as Stoploss in this case
5/n


3. Moving average stoploss
The “well known” moving averages, such as the 50, 100, 200 daily moving averages act as natural support and resistance.
21 ema Momentum Trades
50 ema short term trades
200 ema positional trades
200 Weekly ema Long term trades
6/n
The “well known” moving averages, such as the 50, 100, 200 daily moving averages act as natural support and resistance.
21 ema Momentum Trades
50 ema short term trades
200 ema positional trades
200 Weekly ema Long term trades
6/n


Shouldn’t be used in sidways stocks , either it should be clear uptrend or clear downtrend
Stock Will Give multiple Signals which has to be ignored
Red 21 ema
Green 50 ema
7/n
Stock Will Give multiple Signals which has to be ignored
Red 21 ema
Green 50 ema
7/n


Heres A Tweet about how avoid Big Losses in trading
8/n
https://twitter.com/JayneshKasliwal/status/1487313991991181315?s=20&t=PVh6uFO1QlG6b5fS1YEjQg
8/n
What is Relative Strength ?
📌Relative strength is a strategy used in momentum investing and in identifying value stocks.
📌It focuses on investing in stocks or other investments that have performed well relative to the market as a whole or to a relevant benchmark
9/n
📌Relative strength is a strategy used in momentum investing and in identifying value stocks.
📌It focuses on investing in stocks or other investments that have performed well relative to the market as a whole or to a relevant benchmark
9/n
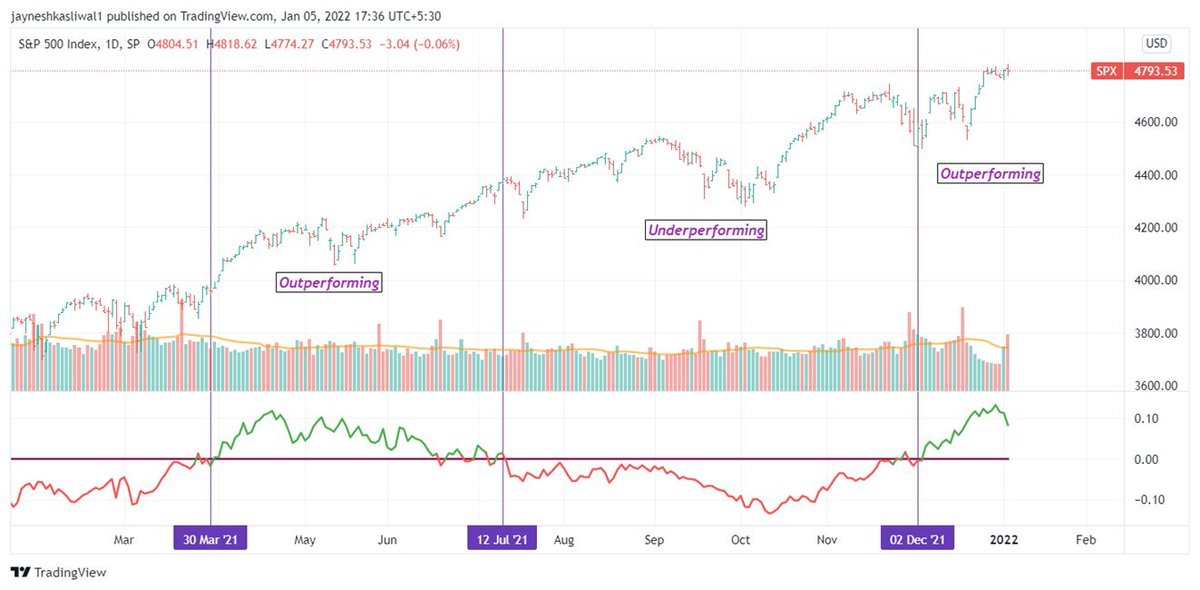
Conditions of Relative Strength
Relative Strength has a reference zero line
Line >0 Stock is Outperforming
Line <0 Stock is Underperforming
RS period 65 as we have around 65 trading days in 3 month
RS reference as Nifty50 as benchmark index as
10/n
Relative Strength has a reference zero line
Line >0 Stock is Outperforming
Line <0 Stock is Underperforming
RS period 65 as we have around 65 trading days in 3 month
RS reference as Nifty50 as benchmark index as
10/n


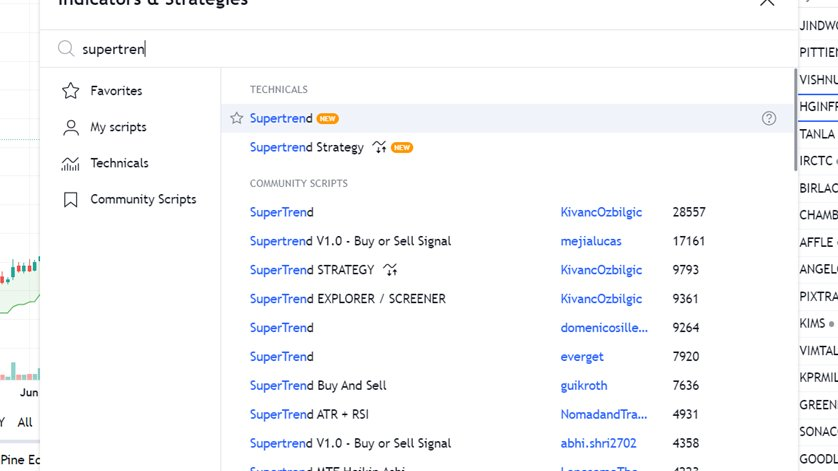
How to apply in #tradingview
Type
“Relative Strength”
Choose any
By bharattrader
By traderlion
By Modhelius
I use by bharattrader
In setting use 65 period
11/n
Type
“Relative Strength”
Choose any
By bharattrader
By traderlion
By Modhelius
I use by bharattrader
In setting use 65 period
11/n

Keep Holding Stocks Till RS is positive to Stay in Complete Trend .
Use 123 for Longer form of trading
Works well in all Markets and all Conditions
12/n
Use 123 for Longer form of trading
Works well in all Markets and all Conditions
12/n


Follow me @JayneshKasliwal fo more such Content
Telegram : t.me/Techno_Charts
Youtube : youtube.com/channel/UCQZW1…
Telegram : t.me/Techno_Charts
Youtube : youtube.com/channel/UCQZW1…
• • •
Missing some Tweet in this thread? You can try to
force a refresh


