This is from #Florida. Left plots compare summer cases (2020 vs 2021) and right plots compare Winter deaths. The bottom row is without vaccination. The top row is with #vaccination. Counties are sorted from lowest (left) to highest (right) vax %. Image
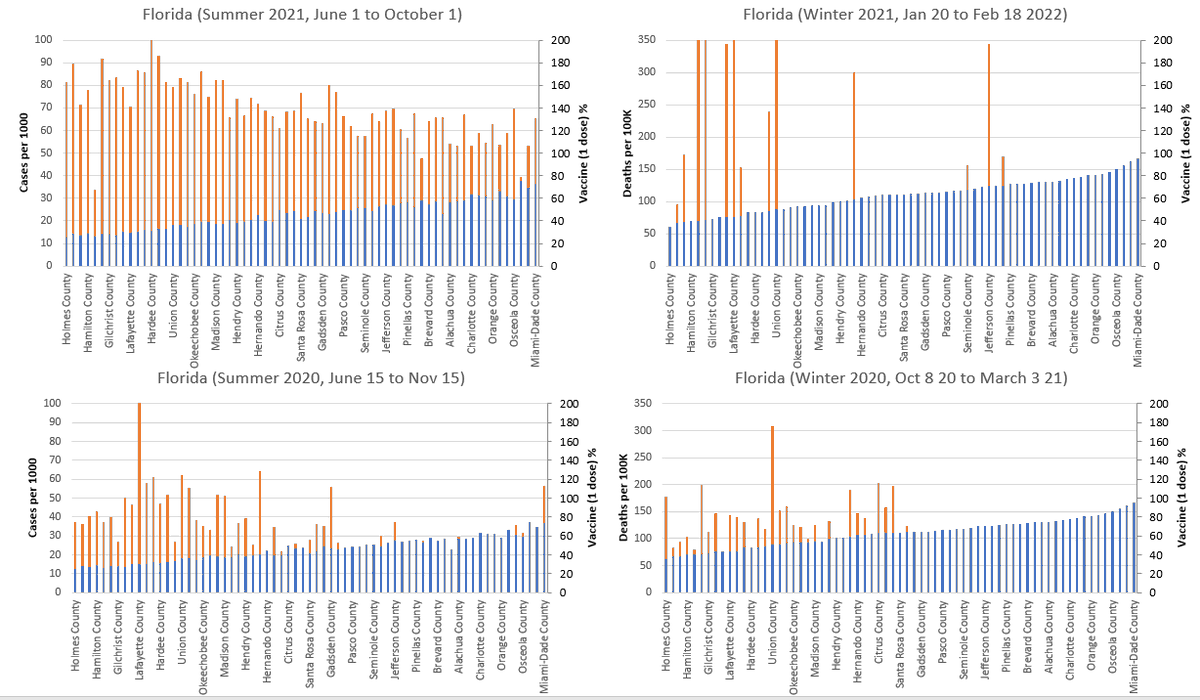
Excess deaths in Summer 2021 (with vaccine) in Florida were 75% higher than excess deaths in Summer 2020 (no vaccine).
After removing vaccination data. Counties are sorted from lowest to highest vaccination rate (from left to right). It is very likely that vaccination causes (which helps in virus spreading) more deaths to unvaccinated people. Image
CORRECTION- I made a mistake! This is the corrected death plot. Previously I made a mistake for the top-right plot. Image

• • •

Missing some Tweet in this thread? You can try to force a refresh
 

Keep Current with Mahmudur Rahman, PhD

Mahmudur Rahman, PhD Profile picture

Stay in touch and get notified when new unrolls are available from this author!

Read all threads

This Thread may be Removed Anytime!

PDF

Twitter may remove this content at anytime! Save it as PDF for later use!

Try unrolling a thread yourself!

how to unroll video
  1. Follow @ThreadReaderApp to mention us!

  2. From a Twitter thread mention us with a keyword "unroll"
@threadreaderapp unroll

Practice here first or read more on our help page!

More from @mahmudme01

Jan 19
Rwanda and Burundi are neighboring countries. However their weather is slightly different. Burundi's summer is hotter than that of Rwanda. With AC, Rwanda's indoor can easily be virus fav while Burundi's indoor may not. Rwanda vaccinated a lot compared to Burundi.
However, Covid death is higher in Rwanda than Burundi which is expected because of virus fav weather in Rwanda. However, vaccine couldn't make any positive impact in Rwanda. Almost same peak from summer's death surge in last year.
Omicron surge in Rwanda did not take the same pattern like USA. This surge is similar to the previous surges while US omicron is way higher from the previous surges. Therefore, we cannot claim that Omicron is highly transmissible than other variants. reuters.com/business/healt…
Read 5 tweets
Jan 18
This study shows that vaccine is alive just because of statistics. When you see a bad picture for 1 dose vaxd people, you will expect a better picture after 2 doses. Because COVID vulnerable are isolated during 1 dose. Therefore, unvaxd and 2 dose vaxd groups are not comparable.
Therefore, it is important to compare unvaxd and vaxd (who receive at least one dose, forget about 14 days protection duration).

In this study, total infected individuals: 951
1 dose vaxd: 340
2 dose vaxd: 294
total vaxd (at least one dose): 634
unvaxd: 317
According to their data, 69% (219) reported at least 1 symptom among unvaxd while 66% (419) reported among vaxd (>1 dose).

But, they reported:
Among the unvaxd, 69% reported at least one symptom vs. 57% among those who received 2 doses & 74% among those who received 1 dose only
Read 5 tweets
Jan 17
My best plots over the course of the pandemic.

Plot #1 COVID cases are strongly modulated by indoor wet bulb temp in USA
Plot #2
Based on UK death data in 2021, COVID and all causes of deaths are higher among vaccinated people (>60 yr old) during Jan-Feb (with my conservative calculation, it's hard to get exact info)

Plot #3
COVID cases are modulated by Wet bulb temp in India. There are more to learn such as the role of other interventions based on climate conditions!
Read 6 tweets
Jan 9
While my conclusion could be right, but I deleted my previous thread because the date interval does not represent that they got sick during that time. This was the date for the first vaccine doses. But it shows that people who got the first doses during winter became sicker. ImageImage
Their studies have a few anomalies as well. In the supplementary document, they showed one-dose vaccinated patient's data endpoint as 8/27/2021. But in Table 1 (main article), the end date is shown as of 9/16/2021. # of the final analytical sample also differs from Table 1. Image
Read 8 tweets
Jan 9
At this moment my room air temperature is 73F and relative humidity is 30% which makes wet bulb temp as 13C. This is a very virus fav climate. That means, if I carry virus in my nasal airway, my body will most likely keep replicating at this temp. Image
This is a typical indoor during winter in USA. Depending on outdoor climate, indoor RH also varies. I generally do nothing except body gives me some signal. Furthermore, I recently recovered. But still, I occasionally sleep keeping humidifier on so that room RH goes above 50%.
Before getting COVID, I usually kept wearing mask too often especially indoor in winter. In 2020, my home was very small (650 sq ft). Therefore, my room WBT remained around or above 15C most of the time (3 people constantly lived indoor). (cont)
Read 12 tweets
Jan 6
This is from UK. Cases are higher among vaccinated people (30 and above age group) while deaths are higher among unvaccinated people.

In Ontario Canada, hospitalization is slightly higher among unvaccinated people. 83% of the population of Ontario is fully or partially vaccinated

However, cases are higher among fully vaccinated people in Ontario.

This happens at a certain time. I call this virus favorable weather.

Image
Read 7 tweets

Did Thread Reader help you today?

Support us! We are indie developers!


This site is made by just two indie developers on a laptop doing marketing, support and development! Read more about the story.

Become a Premium Member ($3/month or $30/year) and get exclusive features!

Become Premium

Don't want to be a Premium member but still want to support us?

Make a small donation by buying us coffee ($5) or help with server cost ($10)

Donate via Paypal

Or Donate anonymously using crypto!

Ethereum

0xfe58350B80634f60Fa6Dc149a72b4DFbc17D341E copy

Bitcoin

3ATGMxNzCUFzxpMCHL5sWSt4DVtS8UqXpi copy

Thank you for your support!

:(