Mahmudur Rahman, PhD Profile picture
soft condensed matter physics: interfacial phenomena and colloidal hydrodynamics. PhD @uofl. Last Postdoc @argonne
UnknownUnknowns Profile picture M.Foschiano Profile picture 2 subscribed
May 31, 2022 5 tweets 2 min read
Previously I showed that cases are growing faster in highly vaccinated (fully vaxd) counties in recent days. Here, you can see that correlation is very similar for booster dosed percentage. That means, counties with higher booster dose percentages have higher caseload. 
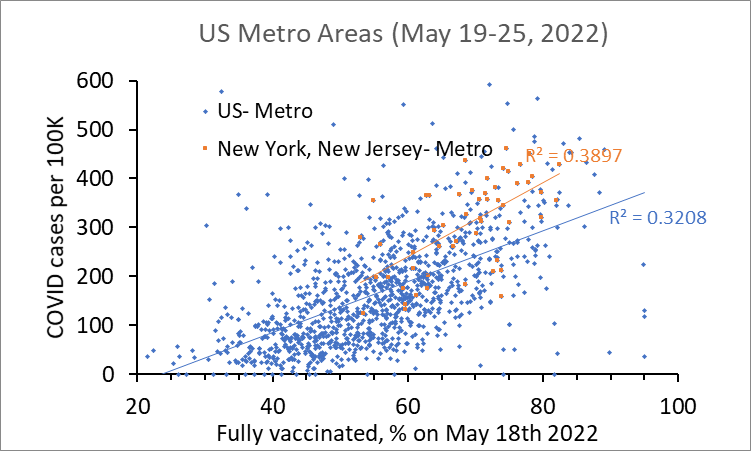
This plot tells me that areas, where more people remained double dosed without boosters, are more likely to spread the virus.
so far positive correlation
-with fully vaxd %
-with booster dose %
-with fully vaxd without booster dose %
May 28, 2022 5 tweets 2 min read
COVID trend in US Metro areas compared to COVID trend in New York and New Jersey metro areas. Each dot represents COVID cases in one week per 100K people. Image COVID cases in North Dakota, South Dakota, Wyoming, and Montana metro areas (counties) compared to US metro areas. Image
Apr 29, 2022 11 tweets 2 min read
I am thinking to quit covid tweet (or minimally active). We are in the phase that there are never ending arguments.

For example, vaccinated someone got COVID and subsequently got heart disease. Science folks will tell you that vaccine saved that person from death. For example, highly vaccinated areas are getting COVID at a higher rate compared to unvaxd areas within a certain locality. Imagine 72 high level people got COVID from DC dinner (one single gathering). Is there any such incidence before vaccination?
Apr 20, 2022 7 tweets 3 min read
Case surge is driven by vaccination. USA is currently experiencing a case surge almost in every state. Here, you can see last 7 days' cases are positively correlated with the vaccination rate. It is more obvious in Metro areas. This is supported by Walgreen's positivity report by vaccination status. If you are vaccinated, you should be scared. If you are unvaccinated but live in highly vaccinated areas, you should be scared too.
Apr 19, 2022 8 tweets 2 min read
Some people think that the situation regarding vaccination has changed since Omicron. This is not true. It happened from the very beginning. Back then, it happened for partially vaxd and now people have taken many doses where so-called breakthrough cases are seen. Another factor here. In earlier times there was much emphasis on vaccine effectiveness. Here, you can see from raw data that vaccine is clearly doing bad job after first dose, but VE shows quite a high number: 31.8%. It should be -ve. How it became +ve and a quite high number?
Apr 13, 2022 4 tweets 1 min read
Unfortunately, I am the only person who is talking about the virus favorable climate. It is the climate at which the virus replicates faster and can make people more sick. The weather has nothing to do with the virus, rather weather plays role in how virus invades the cells. Once we would know how exactly weather plays role in cell membrane fusion process, we would know how vaccine effectiveness and vaccine side effects differ based on climate. We would know when & how mask works. We would know why lockdown is better sometimes while worse other times
Apr 12, 2022 15 tweets 5 min read
The study tells that a vast majority (90%) of the hospitalized patients with COVID-like illnesses (>50 years of age) were COVID negative on the RT-PCR test. From their study- out of 40,505 patients with CLI, only 4,170 patients were COVID-19 positive.
nejm.org/doi/full/10.10… All our pandemic attentions are on the outcome of COVID positive test results. We had to be more cautious in COVID test. For example, if someone has COVID-like symptoms but his/her nasal/throat swab comes negative, he/she should be recommended for a stool test.
Mar 28, 2022 8 tweets 4 min read
These are the US states where the Omicron surge was positively correlated with the vaccination rate. It is really important to thoroughly investigate if vaccine plays role in driving COVID cases. These are the states where correlation is absent or weak. Please stop the vaccine mandate.
Mar 27, 2022 8 tweets 2 min read
We must consider climate conditions to assess the vaccine's role in the pandemic. Vaccine does a worse (or at least no better) job during a virus-fav climate. Here, you can see vaccine is +vely correlated in the circle zone while the vaccine is -vely correlated in the arrow zone. Image We can take a look at the weather condition in two different zones- Multnomah County (shown by arrow) and Union County (inside the circle). Indoor climate in Union county is more virus fav than in Multnomah county. I assume 13C indoor WBT is the most virus fav. Image
Mar 3, 2022 5 tweets 2 min read
Here we see some interesting patterns. Lower age groups died (all deaths) at a higher rate during the summer (2021) wave. We have seen from Israel and UK data that during a surge VE is near zero, zero, or negative. It could be possible that COVID spread through vaccines, however, unvaxd younger aged suffered the most because of lower vaccine uptake. Or, it could also be possible that vaccine caused more adverse effects to younger age people during a surge.
Mar 3, 2022 10 tweets 3 min read
After vaccine rollout in USA, the younger age group suffered (especially 25-44 yrs) more than the older age group. The younger age group survived better during the last winter wave, however, in the summer wave (2021) they died at a higher rate.
Data: data.cdc.gov/NCHS/Weekly-Co… ImageImage 
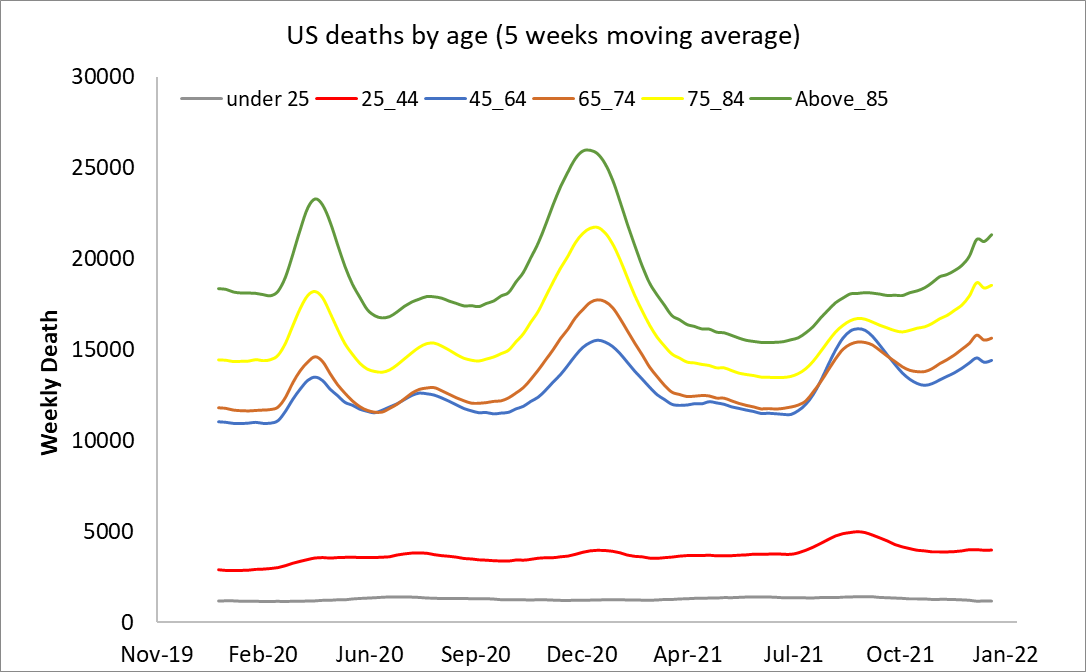
It could also be possible that the summer and winter impacted differently on different age groups.
Feb 24, 2022 9 tweets 4 min read
Where are these non-COVID excess deaths coming from? CDC data is updated on weekly basis. As more data comes in, the predicted data becomes closer to the reported data.
data.cdc.gov/NCHS/Excess-De…
#excessdeath #NoVaccinePassportsAnywhere #Connecticut #Vermont #NYC #NewJersey #COVID19 Image While total excess deaths (including COVID) are comparable between last winter and this winter. It is clear that something else is driving excess death this year among these states. Image
Feb 19, 2022 4 tweets 2 min read
This is from #Florida. Left plots compare summer cases (2020 vs 2021) and right plots compare Winter deaths. The bottom row is without vaccination. The top row is with #vaccination. Counties are sorted from lowest (left) to highest (right) vax %. Image 
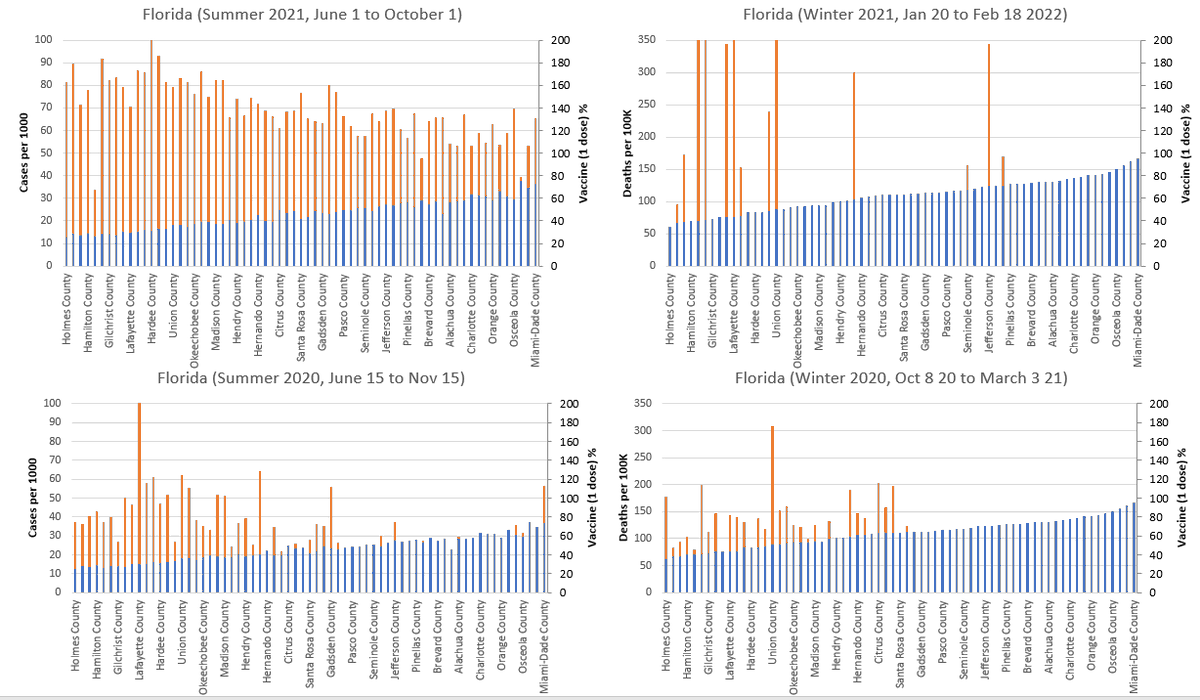
Excess deaths in Summer 2021 (with vaccine) in Florida were 75% higher than excess deaths in Summer 2020 (no vaccine).
Jan 19, 2022 5 tweets 2 min read
Rwanda and Burundi are neighboring countries. However their weather is slightly different. Burundi's summer is hotter than that of Rwanda. With AC, Rwanda's indoor can easily be virus fav while Burundi's indoor may not. Rwanda vaccinated a lot compared to Burundi. However, Covid death is higher in Rwanda than Burundi which is expected because of virus fav weather in Rwanda. However, vaccine couldn't make any positive impact in Rwanda. Almost same peak from summer's death surge in last year.
Jan 18, 2022 5 tweets 2 min read
This study shows that vaccine is alive just because of statistics. When you see a bad picture for 1 dose vaxd people, you will expect a better picture after 2 doses. Because COVID vulnerable are isolated during 1 dose. Therefore, unvaxd and 2 dose vaxd groups are not comparable. Therefore, it is important to compare unvaxd and vaxd (who receive at least one dose, forget about 14 days protection duration).

In this study, total infected individuals: 951
1 dose vaxd: 340
2 dose vaxd: 294
total vaxd (at least one dose): 634
unvaxd: 317
Jan 17, 2022 6 tweets 2 min read
My best plots over the course of the pandemic.

Plot #1 COVID cases are strongly modulated by indoor wet bulb temp in USA
Plot #2
Based on UK death data in 2021, COVID and all causes of deaths are higher among vaccinated people (>60 yr old) during Jan-Feb (with my conservative calculation, it's hard to get exact info)

Jan 9, 2022 8 tweets 2 min read
While my conclusion could be right, but I deleted my previous thread because the date interval does not represent that they got sick during that time. This was the date for the first vaccine doses. But it shows that people who got the first doses during winter became sicker. ImageImage Their studies have a few anomalies as well. In the supplementary document, they showed one-dose vaccinated patient's data endpoint as 8/27/2021. But in Table 1 (main article), the end date is shown as of 9/16/2021. # of the final analytical sample also differs from Table 1. Image
Jan 9, 2022 12 tweets 3 min read
At this moment my room air temperature is 73F and relative humidity is 30% which makes wet bulb temp as 13C. This is a very virus fav climate. That means, if I carry virus in my nasal airway, my body will most likely keep replicating at this temp. Image This is a typical indoor during winter in USA. Depending on outdoor climate, indoor RH also varies. I generally do nothing except body gives me some signal. Furthermore, I recently recovered. But still, I occasionally sleep keeping humidifier on so that room RH goes above 50%.
Jan 6, 2022 7 tweets 3 min read
This is from UK. Cases are higher among vaccinated people (30 and above age group) while deaths are higher among unvaccinated people.

In Ontario Canada, hospitalization is slightly higher among unvaccinated people. 83% of the population of Ontario is fully or partially vaccinated

Dec 8, 2021 8 tweets 2 min read
On Nov 26th, I tested COVID positive. My symptoms (fever and body ache) started on Nov 24th. During Thanksgiving break, I was driving a long distance. After driving four and half hours in a row, I observed my first symptom of illness. While driving I was at different env cond. The last one and half hr I was driving while keeping inside very hot but very dry which I didn't aware at that time. I measured inside air temp (27C) & humidity (16%) which made wet bulb temp 13.16C. This is virus fav environment. I took a very hot shower and continued driving...
Nov 11, 2021 10 tweets 2 min read
The role of COVID vaccine is not just to create immunity, it also causes adverse effects and perhaps makes people vulnerable to COVID during virus favorable weather. Spike protein goes to the cell membrane which can potentially change cell membrane tension. An altered membrane tension can play a diverse role in cellular processes such as cell-cell, cell-vesicle, and cell-virus fusion. Membrane fusion is a highly regulated process. Therefore, someone can expect very diverse and rare side effects due to vaccination.