
A few* folks asked about the map in my Street Art in LA @ironviz, but I don't have a blog or video channel.🥴 So here are just a few random thoughts in a thread. I hope it's helpful.
*In my case, that basically means 2 people.🤣
Link to viz: tabsoft.co/3rwCU8n
1/8
*In my case, that basically means 2 people.🤣
Link to viz: tabsoft.co/3rwCU8n
1/8

First, check out the blogs on circular maps in Tableau by @vizzingbrocks (via @rajvivan) & @sarahlovesdata. As you may notice, many of my vizzes have maps and for most, I employ the same approach of layering maps & images.
vizartpandey.com/create-custom-…
sarahlovesdata.co.uk/2019/04/17/how…
2/8
vizartpandey.com/create-custom-…
sarahlovesdata.co.uk/2019/04/17/how…
2/8
The data were scraped from: losangeles.streetartcities.com
I'm a bit of a novice with coding, so I ended up relying on a software, Octoparse, to extract the info about each piece, artist(s), lat/long, link to full image.
3/8
I'm a bit of a novice with coding, so I ended up relying on a software, Octoparse, to extract the info about each piece, artist(s), lat/long, link to full image.
3/8
TBH, I'm still a bit clunky when working w/ multiple spatial files in Tableau... For my map, I joined a shapefile of cities/neighborhoods & the main file (.xlsx), via intersects & full outer join.
I found this approach in a post by @ryan_callihan:
interworks.com/blog/2021/06/1…
4/8
I found this approach in a post by @ryan_callihan:
interworks.com/blog/2021/06/1…
4/8

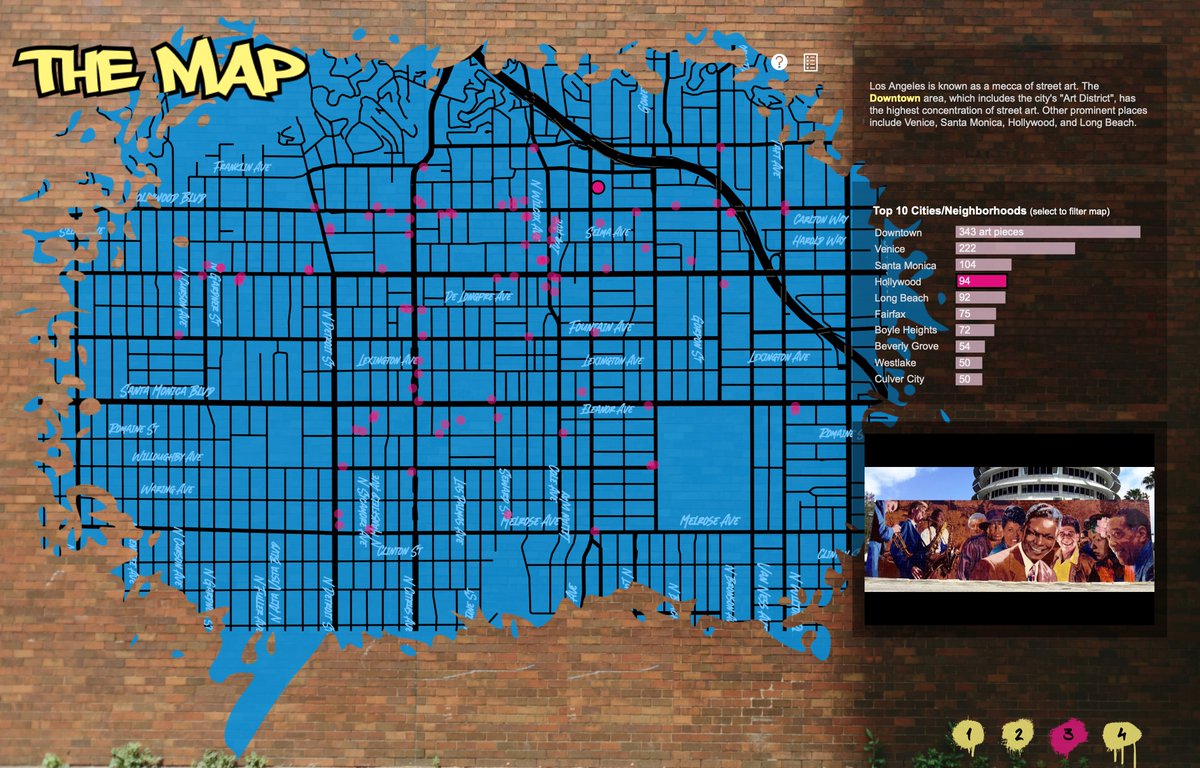
In the dashboard, I overlaid 4 items on top of each other (bottom to top):
*Base image
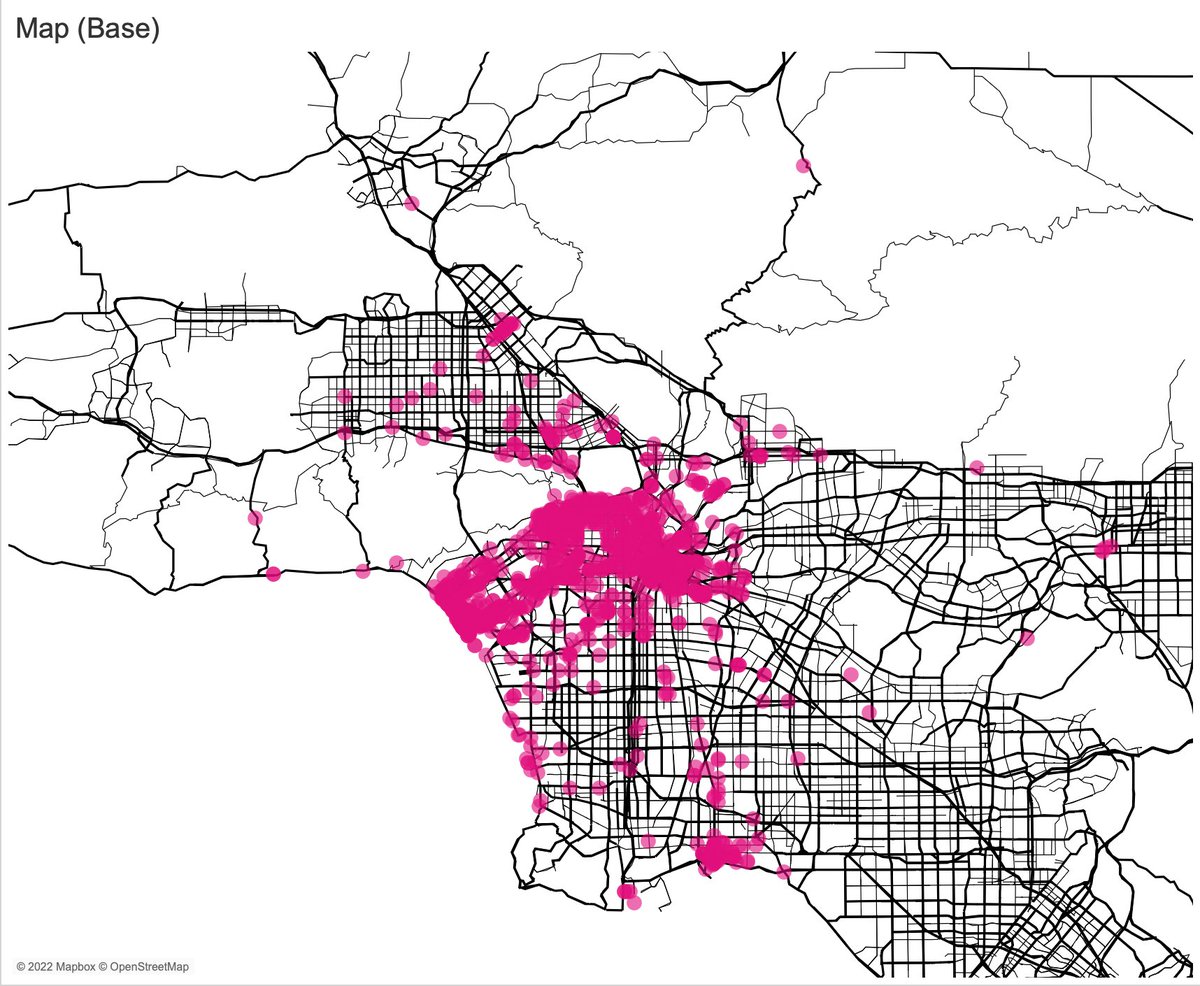
*Base map (circles, roads only via custom Mapbox layer)
*Image (transparent shape)
*Duplicate map (map layers off, selectable circles @ 0% opacity, tooltips, size/placement = base map)
5/8
*Base image
*Base map (circles, roads only via custom Mapbox layer)
*Image (transparent shape)
*Duplicate map (map layers off, selectable circles @ 0% opacity, tooltips, size/placement = base map)
5/8


Images were designed w/ Figma. On top, I placed another image (w/ annotations & dark background @ 20% opacity, & show/hide button).
Map options all turned off.
Filters/parameters applied to both maps.
6/8
Map options all turned off.
Filters/parameters applied to both maps.
6/8

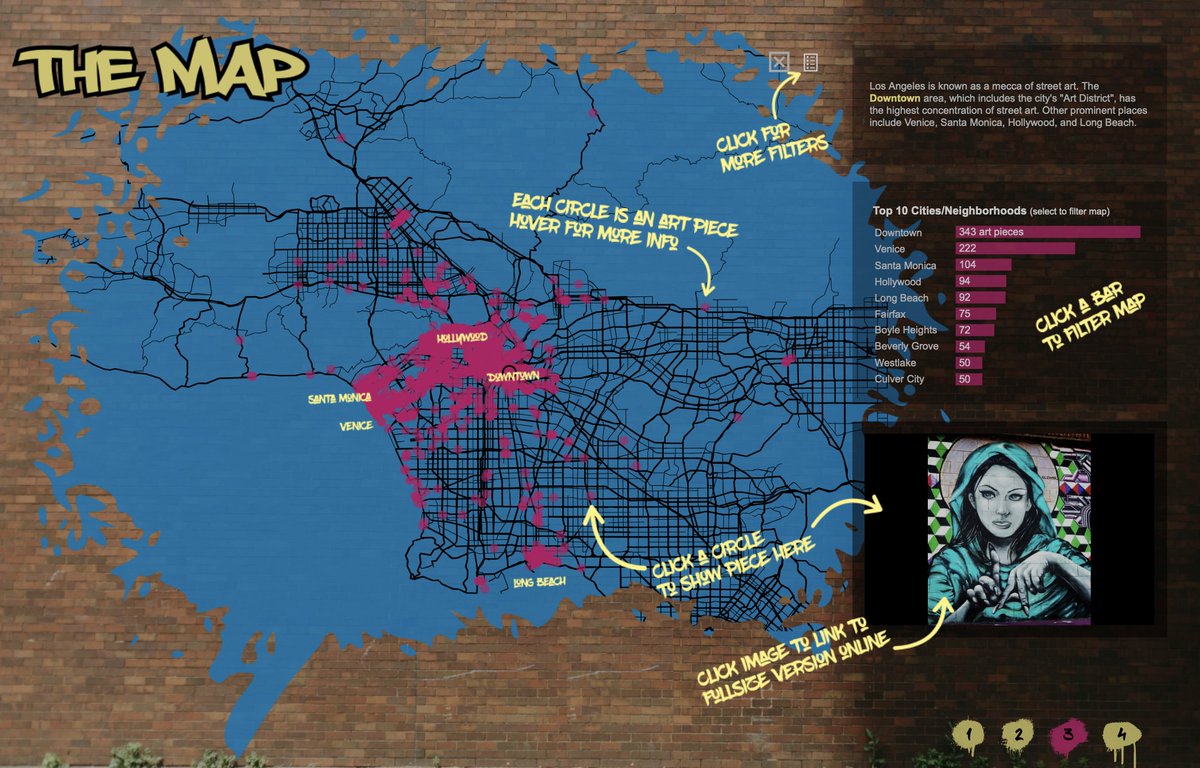
With the image links, an URL action was applied to just the top map layer to allow for selecting, seeing, & linking to each piece.
Tableau Public seems to have an issue w/ images not adjusting its size to fit the container. Here's a nice workaround:
community.tableau.com/s/question/0D5…
7/8
Tableau Public seems to have an issue w/ images not adjusting its size to fit the container. Here's a nice workaround:
community.tableau.com/s/question/0D5…
7/8
I think that's it. The map was definitely my favorite part to design. I'm very happy with how it turned out and humbled by the response.
Of course, I can't really go into as much detail as one could w/ a blog/video. So, let me know if you have any questions!🙏
8/8
Of course, I can't really go into as much detail as one could w/ a blog/video. So, let me know if you have any questions!🙏
8/8
Addendum 1: Both map sheets also have a hidden cities/neighborhoods map layer, which helps w/ the filtering/zooming to specific areas. This is particularly important when there's only a single point (e.g. city of Azusa). Tableau won't know how far or close to zoom-in...


Addendum 2: It didn't occur to me during the process, but thinking back, I used the following tools to create the map: Tableau Public, Excel, Mapbox, QGIS, Figma, and Octoparse.😯
@threadreaderapp unroll
• • •
Missing some Tweet in this thread? You can try to
force a refresh


