
Social Work Prof | Data Viz & Map Designer | @Tableau Visionary & Ambassador | social justice & health equity | he/him/his | perpetual student | No AI Used
 ...and you can create this in @qgis!
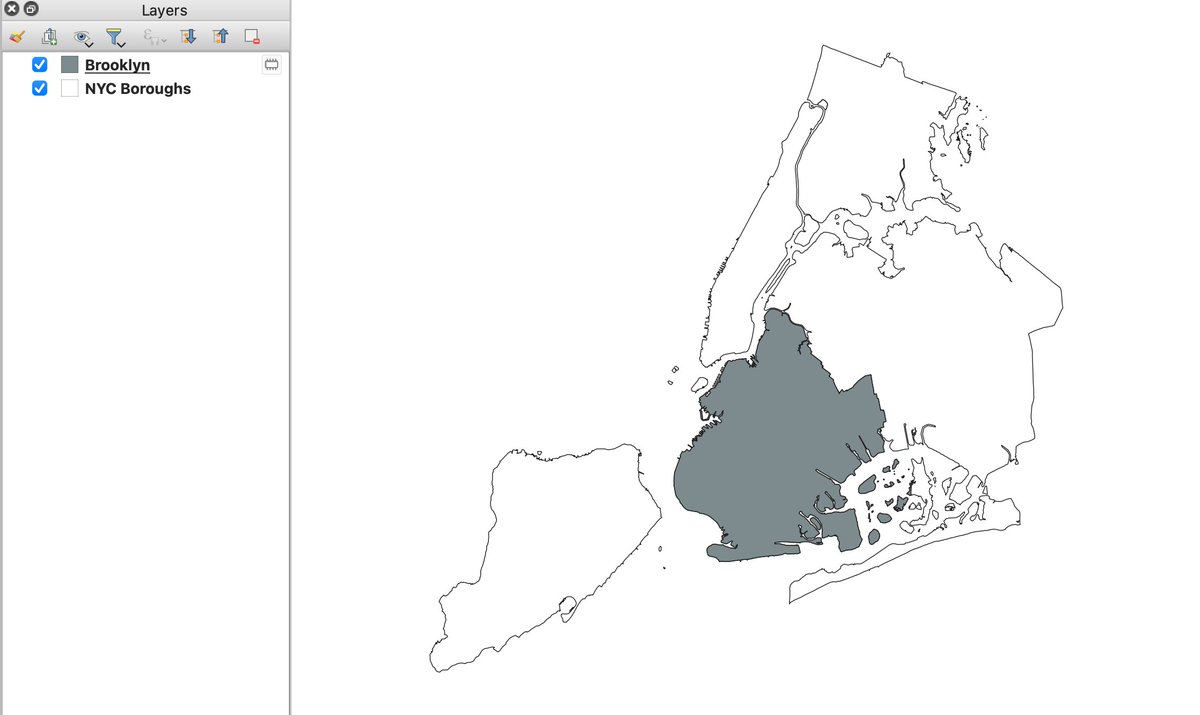

 First, check out the blogs on circular maps in Tableau by @vizzingbrocks (via @rajvivan) & @sarahlovesdata. As you may notice, many of my vizzes have maps and for most, I employ the same approach of layering maps & images.