Blockchain Backer Profile picture
Feb 24, 2022 12 tweets 4 min read Read on X
This is a pretty climatic moment. I'm not a geopolitical expert or capable of solving 5D chess that gets played during wartime situations. But, we can look at how the charts are reacting to this.

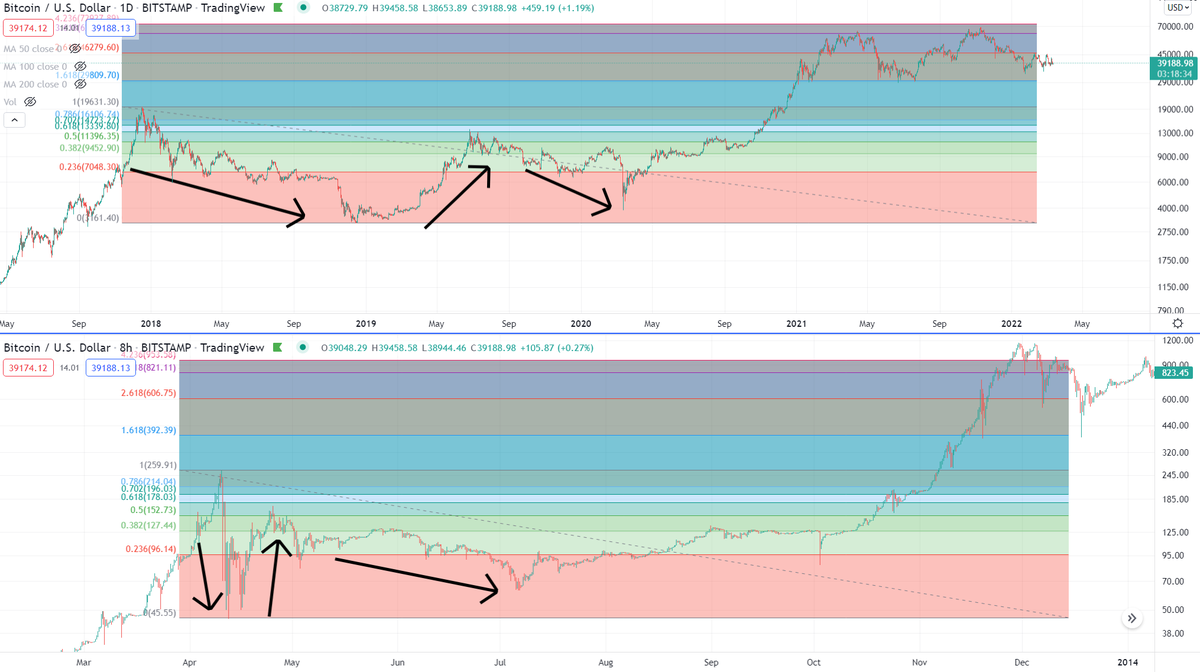
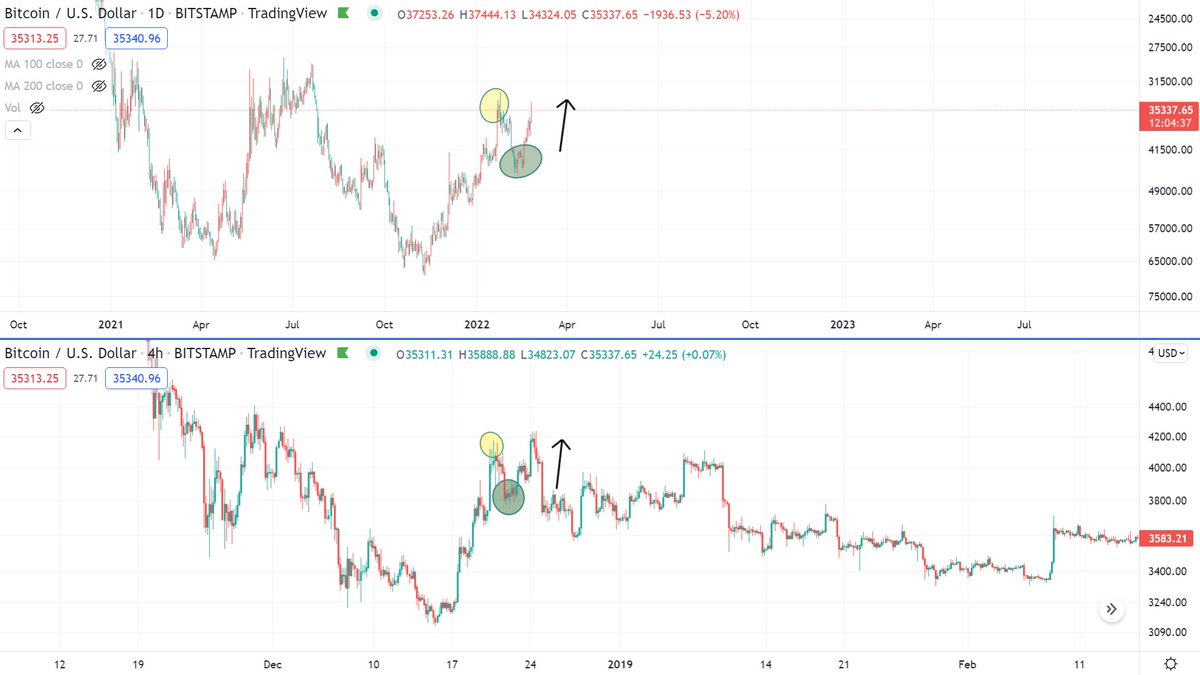
It appears Bitcoin is now deviating from it's 5.5 month structure.

1/12
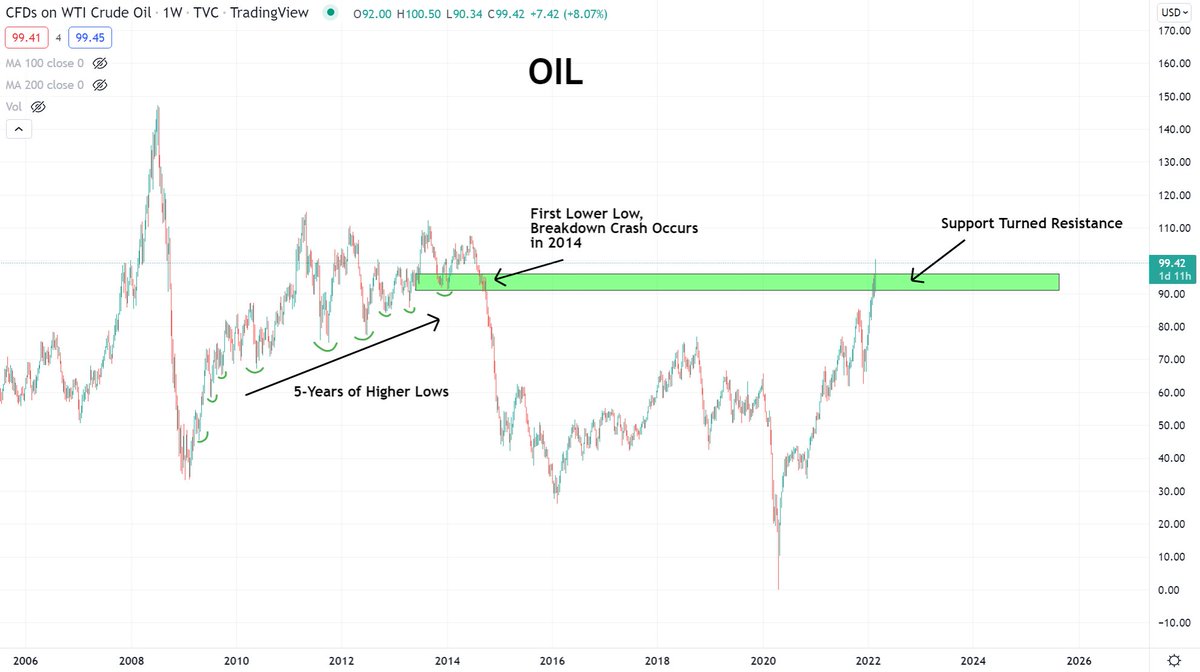
At the same time that this is all occurring, significant things are happening market wide. For example, in 2014, this was OIL's breakdown level. 5-years of higher lows, then it crashed from here. This moment has caused OIL to break through that resistance.

2/12
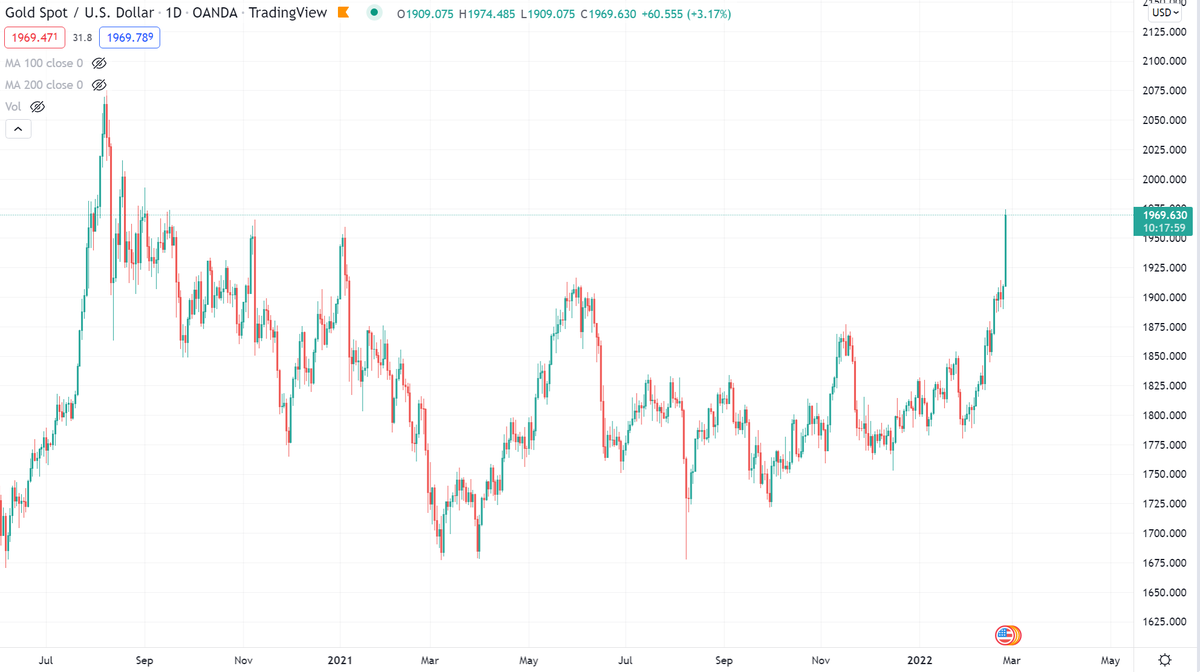
At the same time, precious metals are breaking upward, having the biggest days they've seen in years, with Gold, Silver, and Platinum all pushing up.

3/12
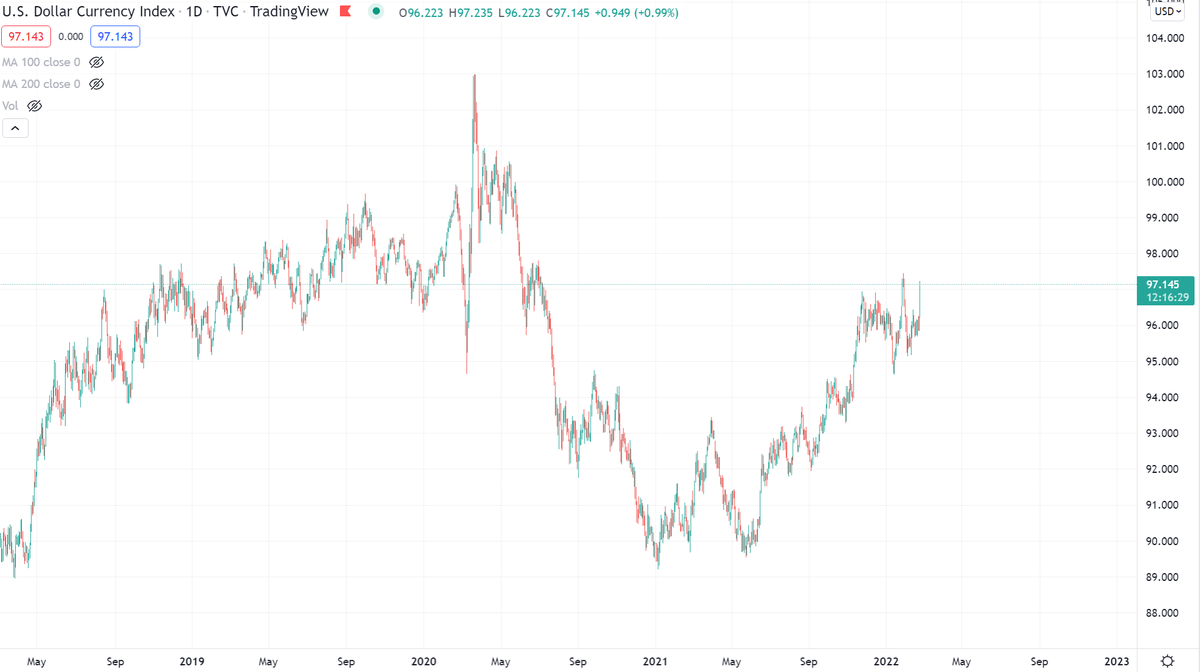
At the same time, the DXY, or the U.S. Dollar Currency Index is taking a pop upwards as well, up almost 1% in a day, which is a big move for the DXY in one day. A "flight to safety".

4/12
Also, the U.S. Stock Market Futures are taking a hit. With the Dow Jones -856. And, not looking pretty.

5/12
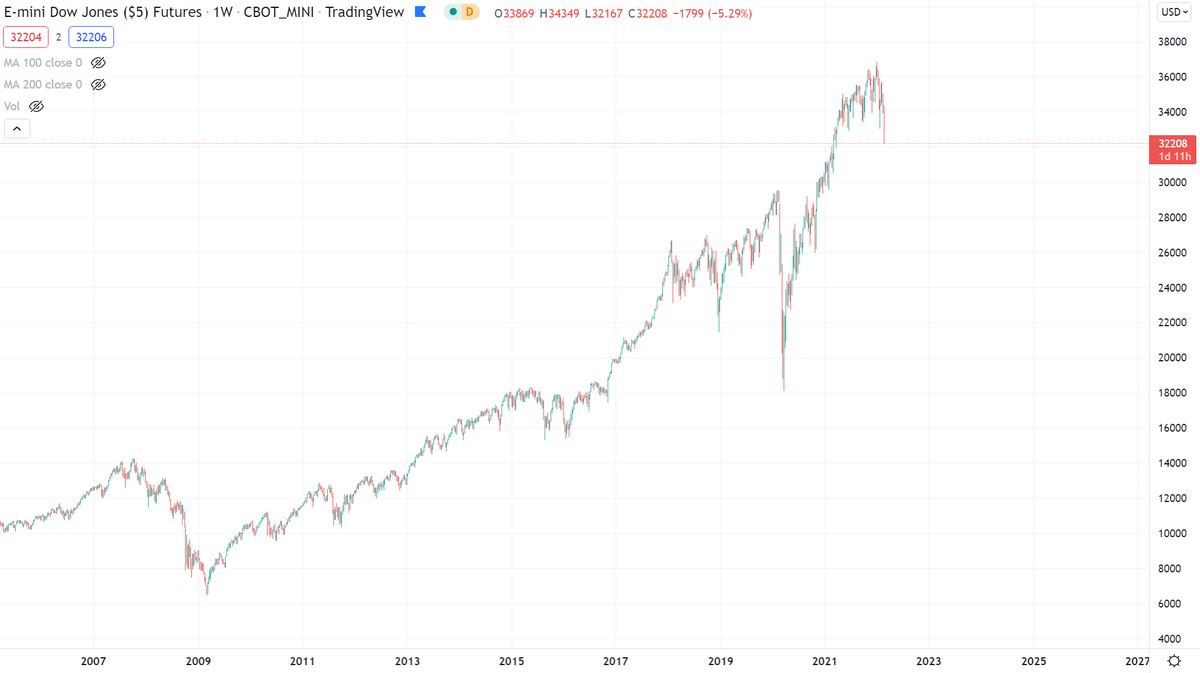
We've studied the Dow Jones in relation to the 1920's many times and that we are in a giant bubble.

6/12
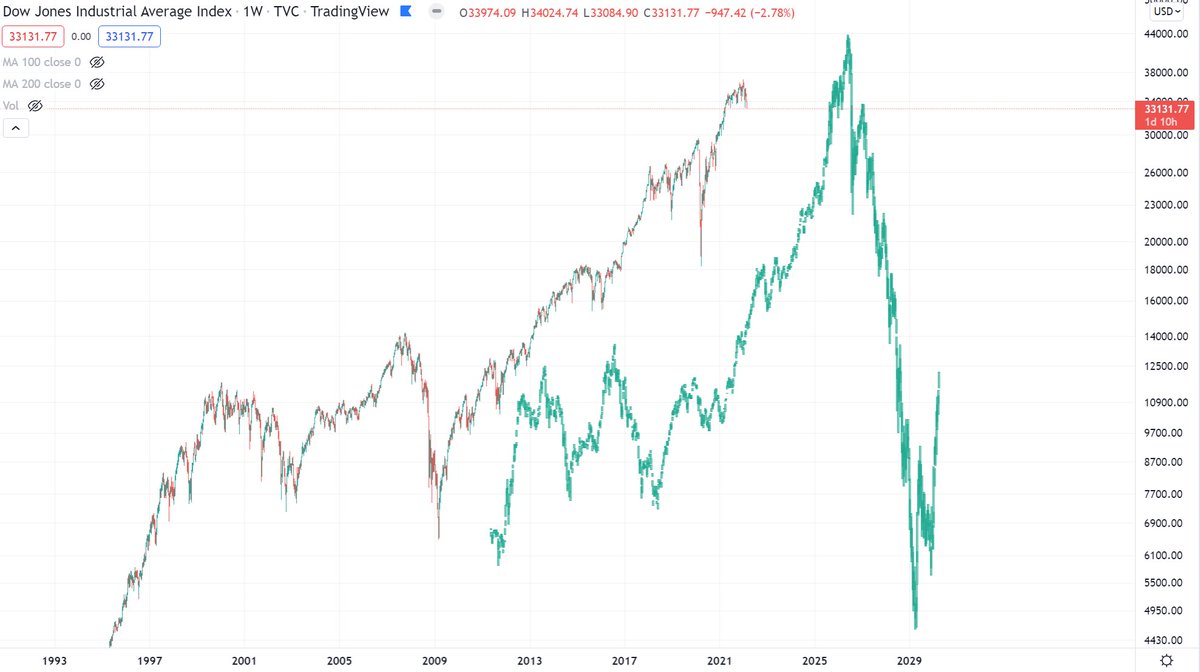
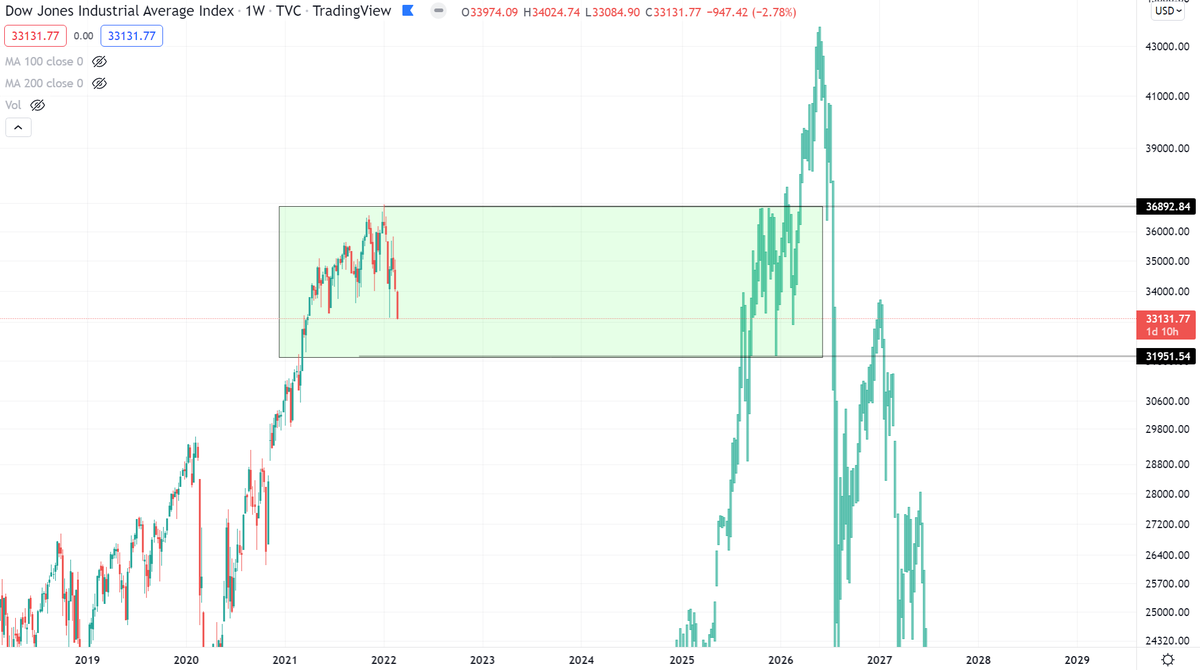
There was a volatility range that occurred up near these equivalent areas of a bubble structure back in the 1920s. The lowest end of that boundary is around 32,000 for the DJI (The DJI is at 32,200 right now pre-market).

Not sure what would happen if it dipped below that.

7/12
But as we can see, commodities are taking off, and equities are taking a fall overnight. And, cryptos are getting lumped in with that equities basket... being tied to the stock market...

8/12
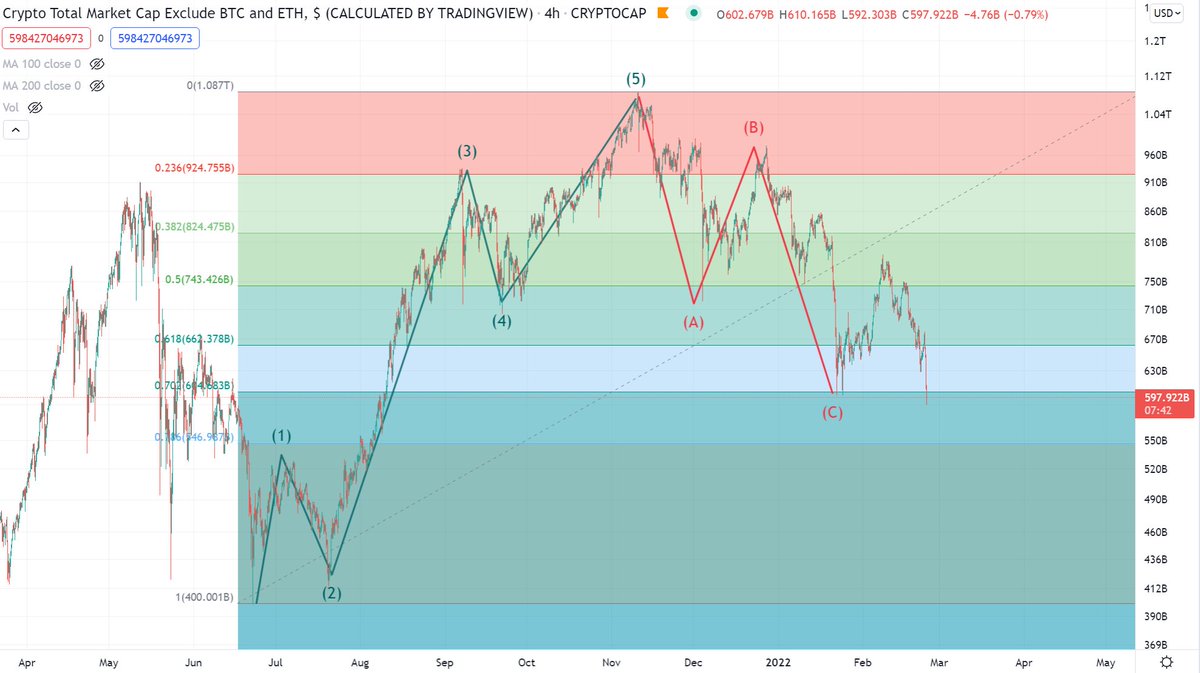
A concerning thing for me is that TOTAL3, the remaining altcoin market is dipping below the .702 retracement level. If we were to have an Elliott Wave structure, this is starting to deviate during this event.

9/12
We've spent a lot of time going through the inverse / inverted charts to show how these things usually play out, and while it would have been nice to fully rely on a 5.5 month fractal, I kept pointing to this because it's the most common way things happen.

10/12
While it's a climatic moment, and I can't reasonably conclude to any degree what the next move will be during this geopolitical event or the consequences of it, especially with it happening in the last several hours, my fingers are crossed we're following that structure.

11/12
We see oil breaking out. Logic points me that could lead to more inflation. Gold, silver and precious metals are breaking out, inflation hedge assets. Those were also the leaders in 2020. But I've got my eyes on that stock market.

Fingers are crossed this wraps up soon.

12/12

• • •

Missing some Tweet in this thread? You can try to force a refresh
 

Keep Current with Blockchain Backer

Blockchain Backer Profile picture

Stay in touch and get notified when new unrolls are available from this author!

Read all threads

This Thread may be Removed Anytime!

PDF

Twitter may remove this content at anytime! Save it as PDF for later use!

Try unrolling a thread yourself!

how to unroll video
  1. Follow @ThreadReaderApp to mention us!

  2. From a Twitter thread mention us with a keyword "unroll"
@threadreaderapp unroll

Practice here first or read more on our help page!

More from @BCBacker

May 20, 2023
Does Bitcoin operate on magical 4-year cycles that have to do with the Bitcoin Block Reward Halving?

Get ready to have your world flipped upside-down if you believe it does.

Because I'm about to build my case that it's an urban myth.

1/x Image
The argument that 4-Year Block Reward Halving's are the cause of bull runs is due to reduced inflationary pressures on Bitcoin's price.

The less Bitcoin that is rewarded to miners, the less sell pressure they have.

Conceptually it makes sense.

But the charts have conflict.
The most recent Bitcoin Block Reward Halving's have occurred on:

May 11, 2020
July 9, 2016
November 12, 2012

Below is the numbers of days it took Bitcoin to "touch" it's all time high post-halving date.

2012: 92-days
2016: 180-days
2020: 204-days Image
Read 30 tweets
Mar 18, 2023
Tinfoil hat time...

On September 17, 2019, the Fed quietly interjected in the overnight lending for banks with Repo bailouts.

The distraction, 8-days later on September 24th was Pelosi announces formal impeachment inquiry of Trump.

THIS DOMINATED HEADLINES.

Notice a pattern?
September 23, distract the internet with Greta Thunburg.

npr.org/2019/09/23/763…
Read 5 tweets
Dec 18, 2022
From a technical perspective, a lot of complications have come up once the FTX collapse happened.

In this thread I'll show the complexities happening in the crypto market compared to 2014 and to 2018.

This is no longer a "few" things, but has become a laundry list.

🧵
Before we start, let's just accept it was not "magic" for why Bitcoin topped in 2021. It was simple. It was a full 4.236 Fibonacci extension for the market cap. It didn't need a thousand indicators of magic to solve.
I can't recall ever seeing a top be the same percentage matchup. They are usually different percentage surges.

But, the 2014 and 2018 bottoms were both equal drawdowns in percentage terms on the market cap for Bitcoin.

Both were just shy of 84% pullbacks.
Read 25 tweets
Sep 26, 2022
1) I believe the Dow Jones Industrial Average has popped.

That the LONG bear market, or "Great Depression" for the DJI has begun.

Many have built careers over the last decade proclaiming the Great Depression was upon us, only for the DJI to rip up 400%+ while they cried wolf. Image
2) I'm going to build a case as to why the 30+ year bear market for the DJI has begun, using charts.

I'll leave it to the experts to decipher trade calls, central bank planning, currency debasement, geopolitical wars, commodity shortages, etc.

But here, I'm just using charts.
3) First thing is Fibonacci Extensions. The Dow Jones, NASDAQ and S&P have all exceeded 3.618 extensions, with the S&P actually hitting the 4.236 extension. Image
Read 25 tweets
Apr 27, 2022
I rarely talk about social pop culture events on here. But, Elon buying Twitter at $54.20 a share has to do with stocks, and I have a weird take on it.

I see the potential of this deal falling through, and there may be a trick up Elon’s sleeve where he still wins.
Three weeks ago, Elon bought 9% of Twitter.

cnbc.com/amp/2022/04/04…
Here is the SEC filing where Elon and Twitter board agreed on $44 billion deal for him to take the company private with 100% ownership at $54.20 per share.
Read 8 tweets
Mar 12, 2022
I've often pointed to the XRP price charts accumulation structure that's been going on since April.

For fun, I've added this chart below. Before you move on in this thread, take a closer look at the chart, and try to guess what asset it is and when it happened?
Did you get it right?

It's Bitcoin from 2013.

An 82% crash in 48-hours. A crash, retrace, re-accumulation structure that went on to reach above a 4.236 extension later in the year.
The structure we had in Bitcoin from 2018-2020 played a large role in why I believed the top was coming in for Bitcoin. I spent years discussing this on YouTube prior to the top happening, so it wasn't a surprise I sounded the alarms there.

2018-2021 was a repeat of 2013.
Read 19 tweets

Did Thread Reader help you today?

Support us! We are indie developers!


This site is made by just two indie developers on a laptop doing marketing, support and development! Read more about the story.

Become a Premium Member ($3/month or $30/year) and get exclusive features!

Become Premium

Don't want to be a Premium member but still want to support us?

Make a small donation by buying us coffee ($5) or help with server cost ($10)

Donate via Paypal

Or Donate anonymously using crypto!

Ethereum

0xfe58350B80634f60Fa6Dc149a72b4DFbc17D341E copy

Bitcoin

3ATGMxNzCUFzxpMCHL5sWSt4DVtS8UqXpi copy

Thank you for your support!

Follow Us!

:(