Undisputed champion 🏆 in option selling and undoubtedly India's best trader @Mitesh_Engr Sir
Lessons on how to trade in such difficult times from the Indian Options Conclave 3.0 by Jainam Broking Ltd
Time for a🧵
Collaborated with @AdityaTodmal
Lessons on how to trade in such difficult times from the Indian Options Conclave 3.0 by Jainam Broking Ltd
Time for a🧵
Collaborated with @AdityaTodmal
How to trade in options during high volatility i.e. India vix>22-23 ?
In the current scenario, option sellers who are deploying strangles are unable to make money
In the current scenario, option sellers who are deploying strangles are unable to make money
E.g.: If a trader is selling a strangle of Rs. 100 each leg then during a fast momentum on either side, one leg becomes 80 & the other one Rs. 200
So overall, the strangle seller is at a loss
Strangles & Straddles are easy to manage in low vix
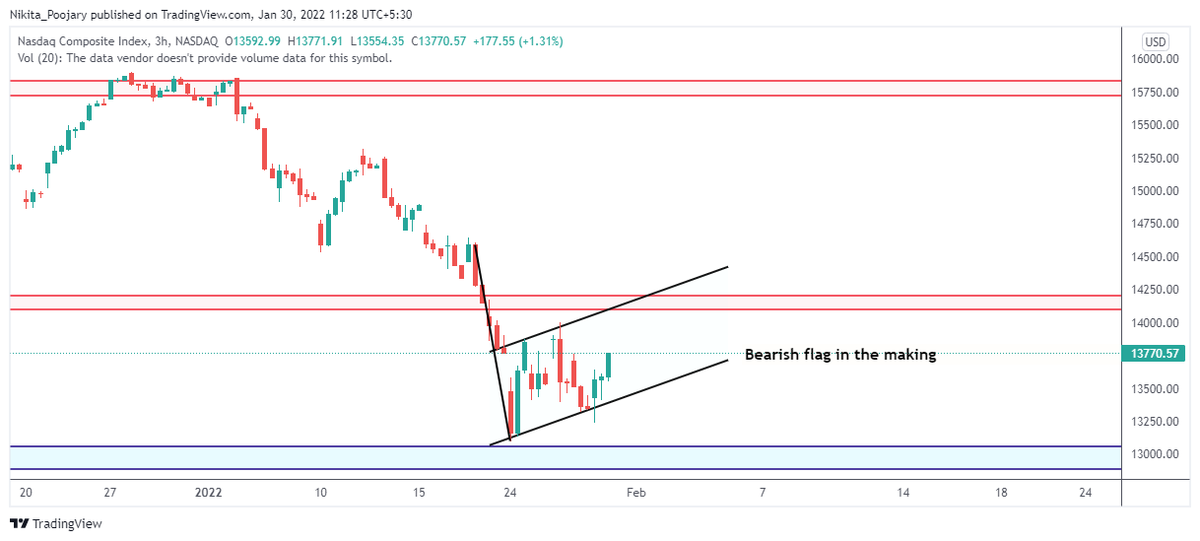
During high vix, find reversals
So overall, the strangle seller is at a loss
Strangles & Straddles are easy to manage in low vix
During high vix, find reversals
Mitesh Sir follows 3min TF in Bank nifty futures chart
Specimen:
Specimen:

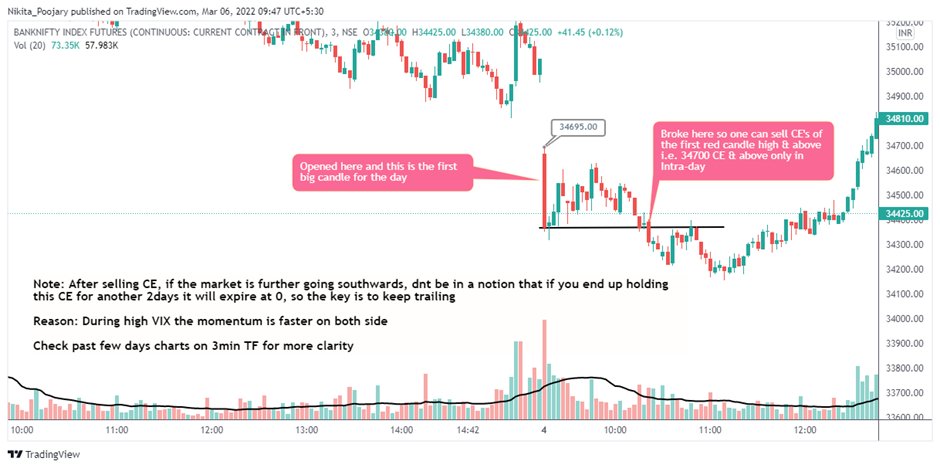
In a down trending market people are tempted to sell CE & avoid selling PE's, however it would be disastrous to hold those CE's till expiry
Trailing is the answer during high VIX, as the momentum is faster on both sides
Check past few days charts on 3min TF for more clarity
Trailing is the answer during high VIX, as the momentum is faster on both sides
Check past few days charts on 3min TF for more clarity
How to find reversals?
Whenever market breaks a support, check the volumes in the downfall
If you intend to catch a trend, then volume is the best indicator for trading, rest all indicators like RSI, MA's etc. are lagging indicators as they indicate post the movement in price
Whenever market breaks a support, check the volumes in the downfall
If you intend to catch a trend, then volume is the best indicator for trading, rest all indicators like RSI, MA's etc. are lagging indicators as they indicate post the movement in price
Hence, volume can be used as a leading indicator
Whenever volumes are declining when prices are making fresh lows, it indicates that the participants are not interested in fresh/further selling for the current period (in intra)
Whenever volumes are declining when prices are making fresh lows, it indicates that the participants are not interested in fresh/further selling for the current period (in intra)
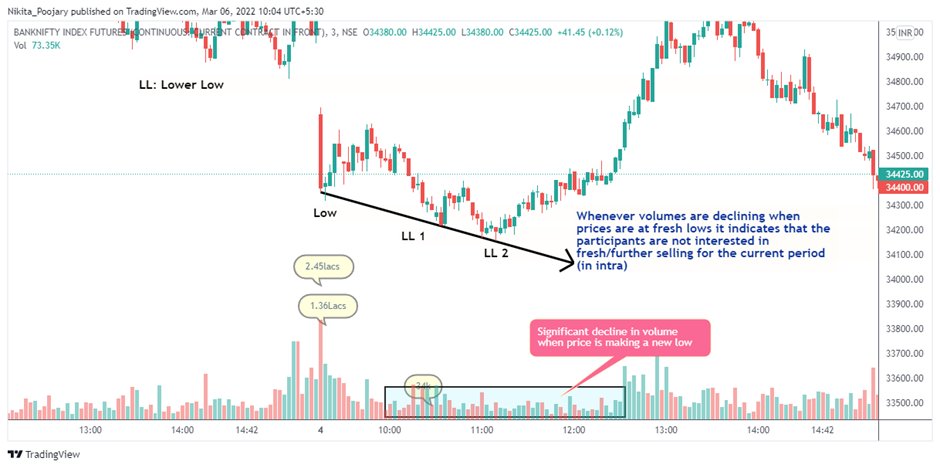
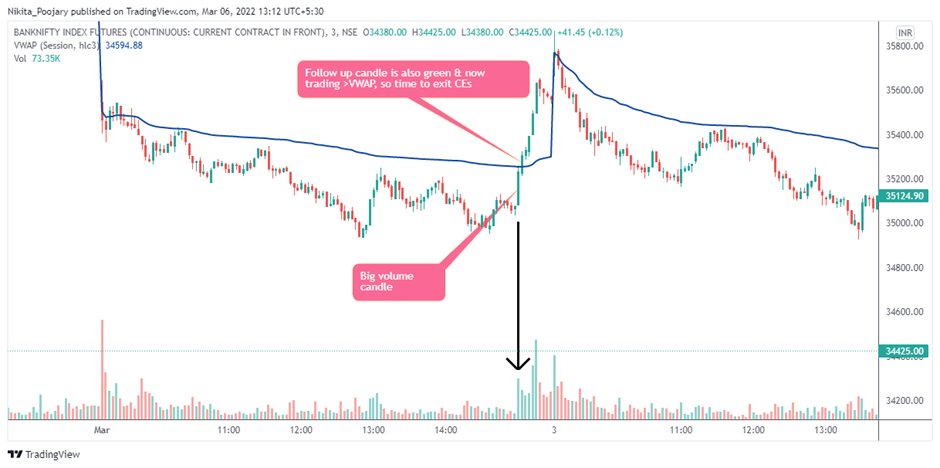
For reversal you just need to take the decision basis one candle which has the highest volume
However all the pre-conditions needs to be met, Lets recap all the conditions to capture reversal from the bottom:
However all the pre-conditions needs to be met, Lets recap all the conditions to capture reversal from the bottom:
1⃣ The ongoing trend was downwards i.e. making fresh lows in intra for the day
2⃣ However, the volumes were shrinking whenever prices were making a fresh low, indicating no more interest by the sellers to push the prices to fresh low
3⃣ LL2 was not breached for the day
2⃣ However, the volumes were shrinking whenever prices were making a fresh low, indicating no more interest by the sellers to push the prices to fresh low
3⃣ LL2 was not breached for the day
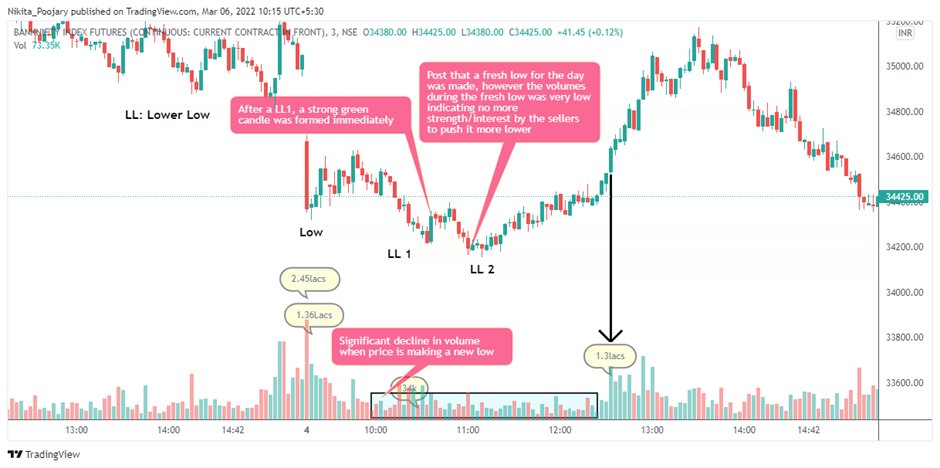
4⃣ Now wait for reversal
5⃣The moment you get a significant volume, on the upside, play for reversal
6⃣In this case, all you need to do is, if you sold CE’s just exit them
5⃣The moment you get a significant volume, on the upside, play for reversal
6⃣In this case, all you need to do is, if you sold CE’s just exit them
Mitesh Sir’s trades on March 4, 2022:
Post gap down, he had sold 35800 which was a PDH and also acted as a high for the past two days, the moment he spotted a reversal from the bottom, he exited from CE’s at 12.35 hours
Post gap down, he had sold 35800 which was a PDH and also acted as a high for the past two days, the moment he spotted a reversal from the bottom, he exited from CE’s at 12.35 hours
Reason: In current scenario, trading is based on news, so if in case there is a cease-fire, market might reverse entirely, so always have to have a SL
How to spot a reversal from the top?
Basis the below chart, he sold 35800 CE at 14.45 again
Basis the below chart, he sold 35800 CE at 14.45 again

Worst case scenario:
Post selling a CE for the 2nd time, lets assume if the prices again start to move up, then you will have a surety of atleast 80% that market is taking support of that level so in this case, the 2nd time after selling a CE, you can sell a PE to adjust it
Post selling a CE for the 2nd time, lets assume if the prices again start to move up, then you will have a surety of atleast 80% that market is taking support of that level so in this case, the 2nd time after selling a CE, you can sell a PE to adjust it
In the first reversal, we wont sell PE’s as we are not sure when it will reverse from the upside, especially when the overall market is in downtrend, however in the 2nd attempt one can take that risk after observing multiple supports
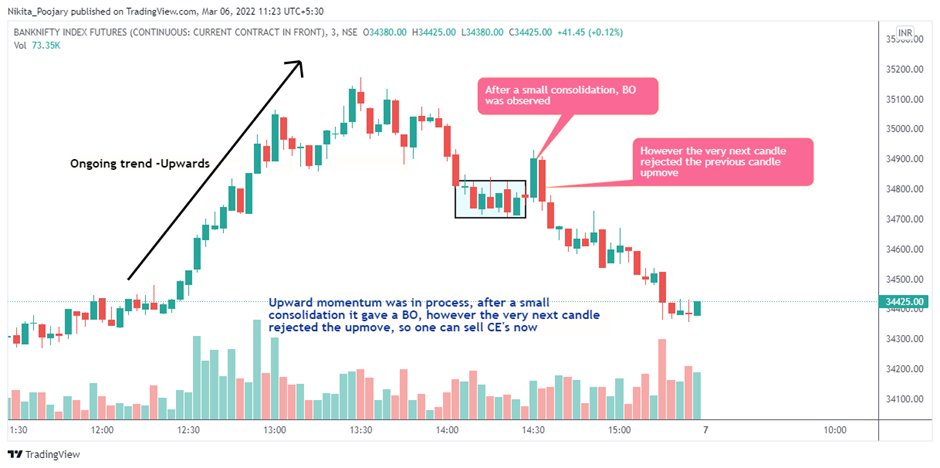
Another set-up: Rejection Candle:
🖊️Ongoing trend: upwards
🖊️After a small consolidation there is a BO
🖊️The very next candle rejected the entire upmove
🖊️Action: CE sell
🖊️Ongoing trend: upwards
🖊️After a small consolidation there is a BO
🖊️The very next candle rejected the entire upmove
🖊️Action: CE sell
One can utilize the same set-up for PE sell as well
🖍️Ongoing trend: downwards
🖍️After a small consolidation there is a BD
🖍️The very next candle rejected the entire down move
🖍️Action: PE sell
The key in finding rejections is to spot large sized candles
🖍️Ongoing trend: downwards
🖍️After a small consolidation there is a BD
🖍️The very next candle rejected the entire down move
🖍️Action: PE sell
The key in finding rejections is to spot large sized candles
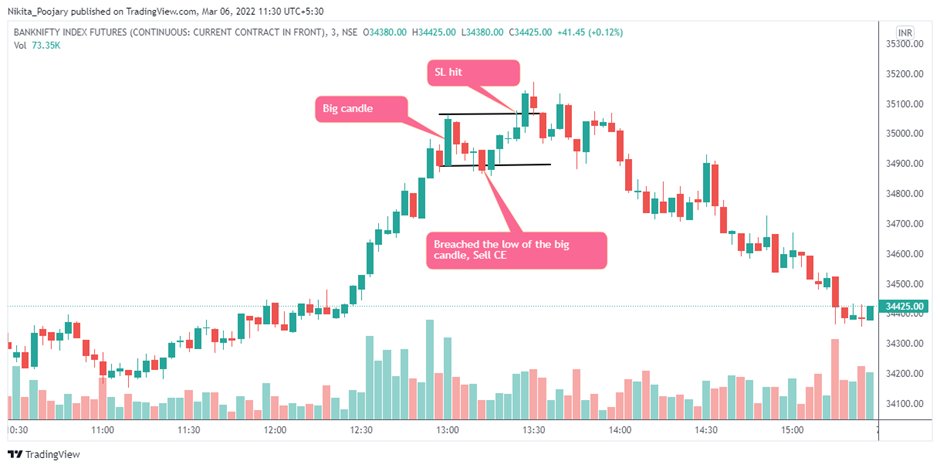
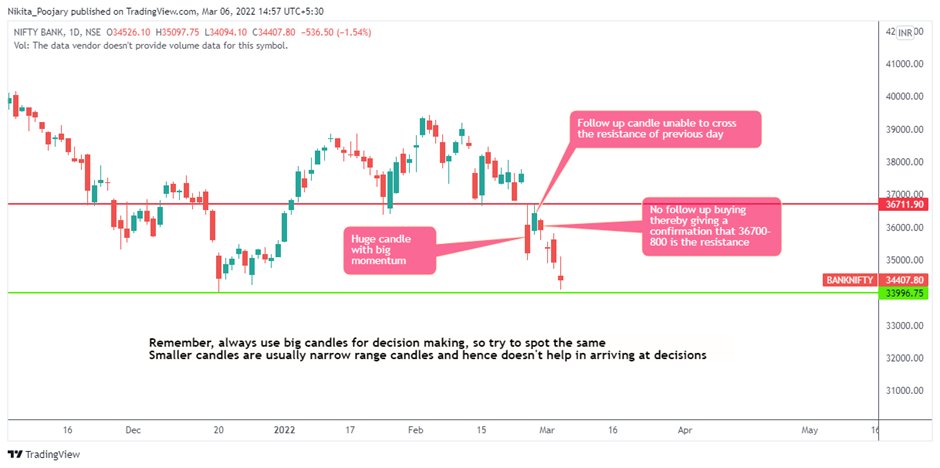
For intra-day all you need to focus is on huge candles
Spot the big candles, you need to act basis the break of the High or Low of that huge candle
Example 1: Here SL got hit
Spot the big candles, you need to act basis the break of the High or Low of that huge candle
Example 1: Here SL got hit
Example 2: Trade worked here

Rejection Set-up: You might get stopped out once twice or thrice , lets say each time it takes 10 points, but then whenever it turns in your favour, you'll be able to fetch 70-80 points
However for this you need to sell high premium options only then it will work
However for this you need to sell high premium options only then it will work
How to play Breakouts (BO)?
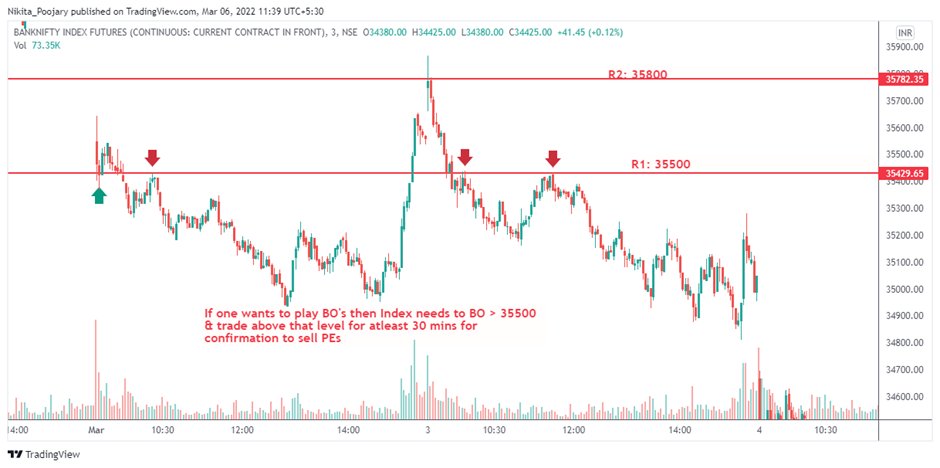
How to spot fake moves?

Another set up to sell CE’s with a small SL and a better R/R set up:

Strangles are not favorable on Friday, Monday & Tuesday in current environment i.e. high VIX
Better to play with reversal set ups on these days, with small SL
Overall profit/loss ratio would triumph the lower win ratio
Better to play with reversal set ups on these days, with small SL
Overall profit/loss ratio would triumph the lower win ratio
Mitesh Sir trades only in weeklies & avoids monthly options, as it is difficult to predict the trend beyond 3 days
Trade set up: He uses one indicator i.e. VWAP, if prices trade > VWAP indicates buyers are strong & vice-versa
Thereafter, he relies only on big volume candles
Trade set up: He uses one indicator i.e. VWAP, if prices trade > VWAP indicates buyers are strong & vice-versa
Thereafter, he relies only on big volume candles
How to initiate option selling during normal market conditions?
In times of normal market conditions when there are no gap ups & gap downs, then you just need to spot weekly S/R
In times of normal market conditions when there are no gap ups & gap downs, then you just need to spot weekly S/R
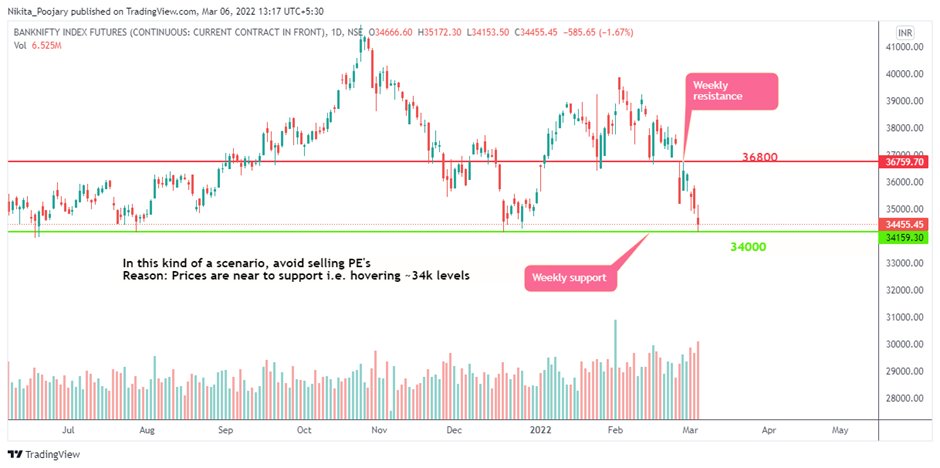
During normal market conditions, spot the weekly Support & resistance
Scenario 1: if the prices are between both, one has to simply sell 1% above & below the resistance & support respectively to make consistent returns via options selling
Scenario 1: if the prices are between both, one has to simply sell 1% above & below the resistance & support respectively to make consistent returns via options selling
Scenario 2: If price is hovering near support, only Sell CE’s
Scenario 3: If price is hovering near resistance, only Sell PE’s
Greedy traders think that they can eat prem on both sides while keeping their margin low as strangle attracts lower margin than directional
Scenario 3: If price is hovering near resistance, only Sell PE’s
Greedy traders think that they can eat prem on both sides while keeping their margin low as strangle attracts lower margin than directional
However during Scenario 2& 3 such greedy positions traders would be badly screwed
Lets take the example of current weekly S/R i.e 34k & 36800, assuming VIX is normal & there are no news. In that case, as a positional trader one is supposed to sell only CE’s
Lets take the example of current weekly S/R i.e 34k & 36800, assuming VIX is normal & there are no news. In that case, as a positional trader one is supposed to sell only CE’s
Lets understand the worst case scenario: if the market takes support of 34k and bounces back and starts to trade above 1.5% above the lows i.e. 34500-34550, then one can have an outlook to sell PE’s as well as some kind of immediate bottom for the week has been made
So the idea is to then convert your directional only CE sell to strangle by selling a PE after it taking some support
However remember you don’t have to exit the CE’s unless the resistance of 36800 is taken out
However remember you don’t have to exit the CE’s unless the resistance of 36800 is taken out
Traders fear that the CE that they have sold at Rs. 50 has doubled i.e. 80-100-120 and they exit
However these are intermediary spikes, the moment prices hit the resistance and stays there, time decay will come into play
However these are intermediary spikes, the moment prices hit the resistance and stays there, time decay will come into play
If the index really is trying to break the resistance, we can get the indication of the same by looking at volumes
If the market is trying to move up from lows, then buyers would wipe out all the sellers, in such case they need to absorb all the selling i.e. volumes will⬆️
If the market is trying to move up from lows, then buyers would wipe out all the sellers, in such case they need to absorb all the selling i.e. volumes will⬆️
So, if the volumes are going up along with the prices for 30min to 60mins then it is a clear indication that buyers are dominating
In such scenario, exit CE’s and short only PE's
However if the price upmove is not backed by the surge in volume then stay in CE sell position
In such scenario, exit CE’s and short only PE's
However if the price upmove is not backed by the surge in volume then stay in CE sell position
If the buyers really want to take the market up, they will buy as much as possible thereby witnessing a surge in volume & that too back to back candles will have huge volume
Big money/operators 👣 can be tracked from volumes
Big money/operators 👣 can be tracked from volumes
So in case the CE option of Rs. 50 that you have sold has doubled, however there is no surge in volumes then you can stay in that CE and try to adjust it by selling a PE
The last adjustment is to convert the strangle into straddle.
The last adjustment is to convert the strangle into straddle.
Lets say the combined prem of that straddle is Rs. 600 then one can keep a SL of 600 on each side, now if the market still keeps trending on the upside the SL on the CE leg will get hit however the PE leg would give you some gains
And if one still has balance capital & if the trend is clear one can sell more PE's
Another scenario, even if one end up making a loss in the current week, the upcoming week one can sell a PE of higher prem as a strong base and support is made in the previous week
Another scenario, even if one end up making a loss in the current week, the upcoming week one can sell a PE of higher prem as a strong base and support is made in the previous week
In option selling, one has to spot strikes which has high probability of going to 0
In case the market moves up strongly after taking a support of 34k (in normal market conditions) Mitesh Sir would sell 34k PE’s
If the prices keep going up then he’ll keep moving up his PE's
In case the market moves up strongly after taking a support of 34k (in normal market conditions) Mitesh Sir would sell 34k PE’s
If the prices keep going up then he’ll keep moving up his PE's
Eg: Spot = 34550 backed by higher b2b volumes, he will sell 34k PE, now if the index further moves to 34800-35k he would roll up his PE’s to 34200
He would maintain a distance of 1.5% at all times as that will give him the time/cushion for adjustments in case of any reversal
He would maintain a distance of 1.5% at all times as that will give him the time/cushion for adjustments in case of any reversal
Mitesh Sir has made huge fortune in option selling since 2017 using the above method
Example:
Feb 25th buyers rejected the heavy selling made on Feb 24th
On the third day (Feb 28th), if the buyers were really strong they would have further taken up BNF, however notice that on the third day BNF fails to cross event he 2nd day high that itself is a confirmation
Feb 25th buyers rejected the heavy selling made on Feb 24th
On the third day (Feb 28th), if the buyers were really strong they would have further taken up BNF, however notice that on the third day BNF fails to cross event he 2nd day high that itself is a confirmation
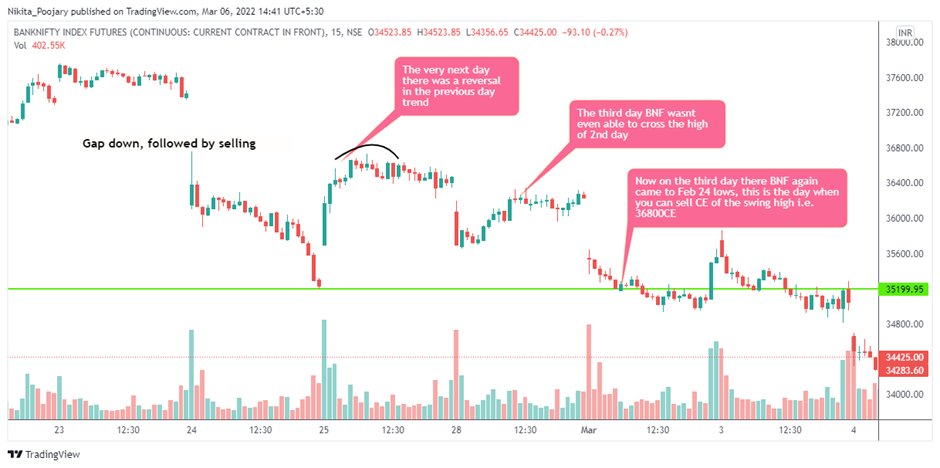
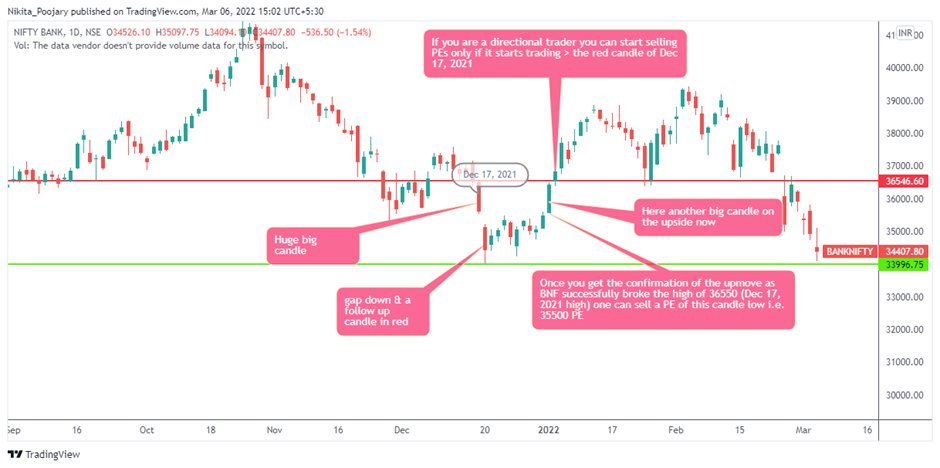
Further confirmation was on the following day i.e. Mar 1 post the gap down opening itself one can sell CE of swing high i.e. 36800CE
However for a safe trader, he can still wait for a confirmation i.e. when BNF reaches the low made on Feb 24, at that time he can sell the CE
However for a safe trader, he can still wait for a confirmation i.e. when BNF reaches the low made on Feb 24, at that time he can sell the CE
Always make decisions based on huge candles the way we saw in intra day same applies in higher TF as well
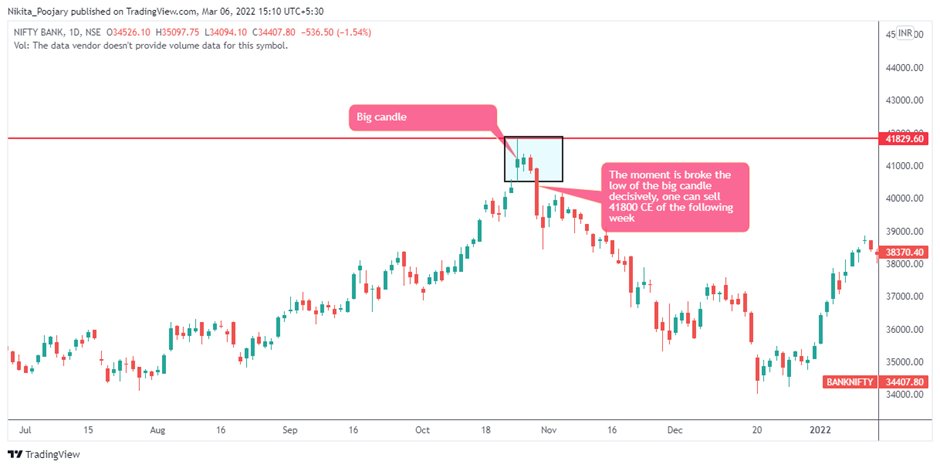
Example 1: On huge candles and trade logic
Example 1: On huge candles and trade logic
Example 2: On huge candles and trade logic
Example 3: On huge candles and trade logic

Example 4: On huge candles, when BNF hit fresh ATH and trade logic
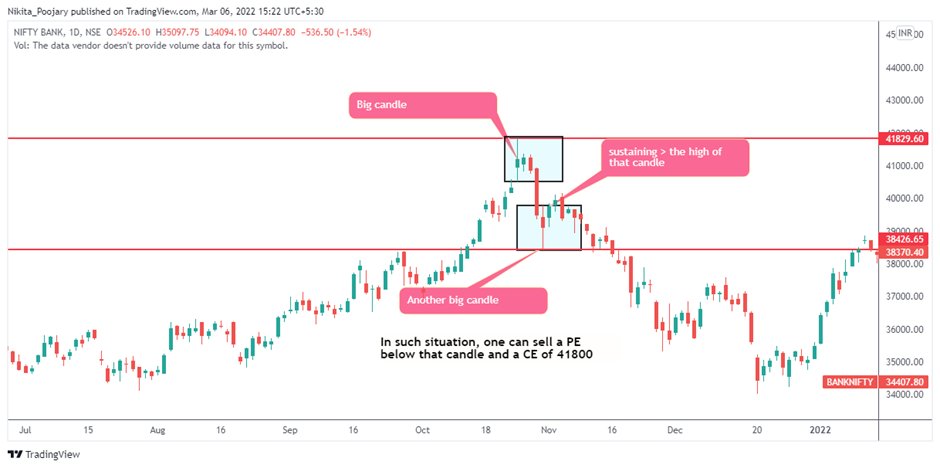
Example 5: On huge candles (strangle) and trade logic
One can practice these 5 examples in single lot to gain confidence
One can practice these 5 examples in single lot to gain confidence
Mitesh Sir doesn’t believe in Credit/Debit spreads
E.g.: Sell OTM strike X at Rs. 90
Buy far OTM strike X+500 points at Rs. 45
If the index goes down then:
Strike X = Rs. 70
Strike X + 500 = Rs. 35
Net reward: Rs. 10 only
Despite capturing the move, making only Rs. 10 ☹
E.g.: Sell OTM strike X at Rs. 90
Buy far OTM strike X+500 points at Rs. 45
If the index goes down then:
Strike X = Rs. 70
Strike X + 500 = Rs. 35
Net reward: Rs. 10 only
Despite capturing the move, making only Rs. 10 ☹
Lets say close to the expiry
Strike X = Rs. 10
Strike X+500 = Rs. 2
Now if you still holding this and in case there is a reversal
Strike X = 90
Strike X +500 = 0
Mitesh Sir, sells only those strikes which has 90% probability of going to 0
Strike X = Rs. 10
Strike X+500 = Rs. 2
Now if you still holding this and in case there is a reversal
Strike X = 90
Strike X +500 = 0
Mitesh Sir, sells only those strikes which has 90% probability of going to 0
If you are using leverage by buying far OTMs to sell more qty
Leverage is a double edged sword, it will have a multiplier effect when you make money & similarly when you lose
So each individual needs to check the risk capacity and accordingly stick to their position sizing
Leverage is a double edged sword, it will have a multiplier effect when you make money & similarly when you lose
So each individual needs to check the risk capacity and accordingly stick to their position sizing
The current SEBI norms of margins will ensure you won't lose more than 5% of your capital (if you are trading using only your capital w/o leverage)
One can make consistent 3% monthly return and if compounded works out to 38-40% p.a. which very few other business can generate
One can make consistent 3% monthly return and if compounded works out to 38-40% p.a. which very few other business can generate
Traders are unsatisfied due to absolute returns instead of focusing on RoC
If your capital is low ~Rs. 10lacs & you are making 3-4lacs p.a. instead of being☹️by the absolute amt, be disciplined to make it consistently as compounding magic will play out in the longer term
If your capital is low ~Rs. 10lacs & you are making 3-4lacs p.a. instead of being☹️by the absolute amt, be disciplined to make it consistently as compounding magic will play out in the longer term
@Mitesh_Engr Sir himself targets only 1% a week via option selling
anything>1% is bonus
SL is always based on the levels and not on points or %
Needless to say @Mitesh_Engr Sir has shared everything in detail & it is nothing less than a workshop in itself
anything>1% is bonus
SL is always based on the levels and not on points or %
Needless to say @Mitesh_Engr Sir has shared everything in detail & it is nothing less than a workshop in itself
• This was a 🧵on the Indian Options Conclave 3.0 conducted by Jainam Broking Ltd; Speaker: @Mitesh_Engr Sir
• Link: bit.ly/3KjHkpt
• If you❤️this, why not share?
• 🔃 the first tweet and help others find this🧵
See past 🧵 here:
@AdityaTodmal
&
@niki_poojary
• Link: bit.ly/3KjHkpt
• If you❤️this, why not share?
• 🔃 the first tweet and help others find this🧵
See past 🧵 here:
@AdityaTodmal
&
@niki_poojary
• • •
Missing some Tweet in this thread? You can try to
force a refresh