Today’s #COVID19 data shows increases in infections across all four nations of the UK ⬇
ow.ly/b05t50IgX0v
ow.ly/b05t50IgX0v

#COVID19 infection rates remained high across all regions of England.
Increases were seen in
▪️the North West
▪️East Midlands
▪️West Midlands
▪️East of England
▪️and London
in the week ending 5 March 2022.
Increases were seen in
▪️the North West
▪️East Midlands
▪️West Midlands
▪️East of England
▪️and London
in the week ending 5 March 2022.

Infection rates increased in England for those aged 25 years and over and decreased in those aged school Year 7 to 11, in the week ending 5 March 2022. 

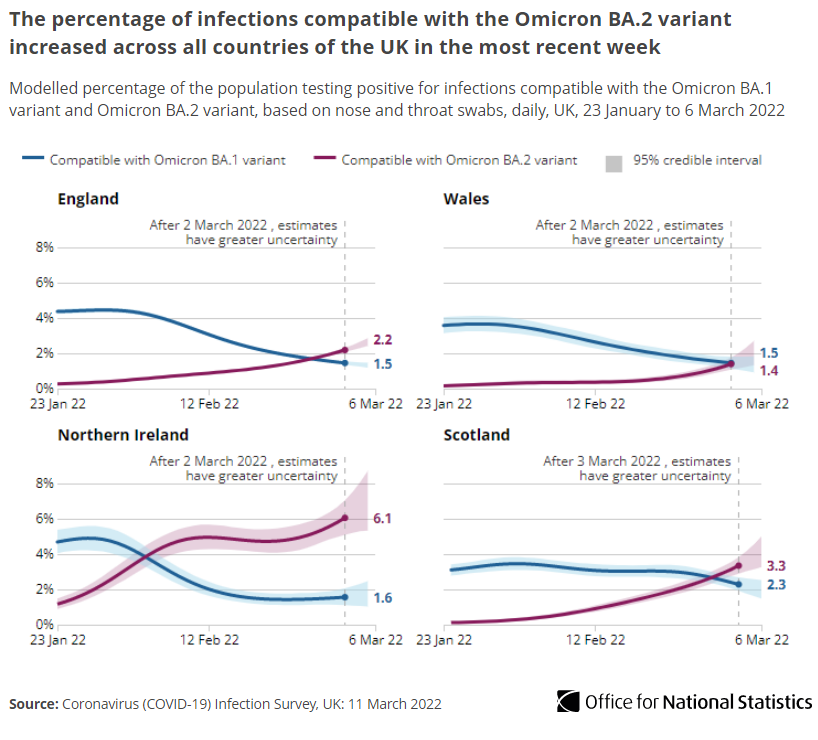
Up to 6 March 2022, Omicron BA.2 variant infections increased in England, Wales, Northern Ireland and Scotland.
In contrast Omicron BA.1 variant infections decreased in England, Wales and Scotland with an uncertain trend in Northern Ireland ow.ly/b05t50IgX0v
In contrast Omicron BA.1 variant infections decreased in England, Wales and Scotland with an uncertain trend in Northern Ireland ow.ly/b05t50IgX0v
Our #COVID19 insights interactive tool shows the latest trends in infections, deaths and hospitalisations.
Data on COVID-19 from the ONS, Joint Biosecurity Centre and @UKHSA highlights the state of the pandemic across the UK ow.ly/b2S450IgXOC
Data on COVID-19 from the ONS, Joint Biosecurity Centre and @UKHSA highlights the state of the pandemic across the UK ow.ly/b2S450IgXOC

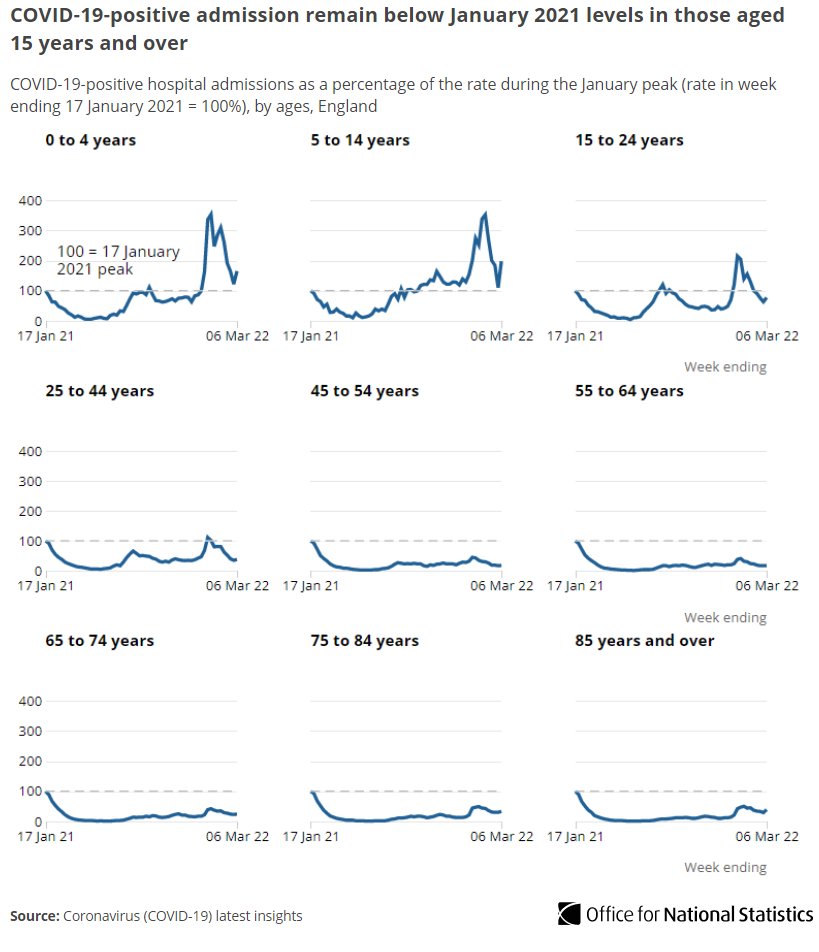
#COVID19 hospitalisations increased in England in the week ending 6 March 2022, with most regions and age groups seeing increases ow.ly/ws4v50IgXZ7 

Positive #COVID19 hospital admissions in children aged under 15 years (for 27 Feb 2022), were over one a half times the peak admission for these age groups from 17 Jan 2021 ow.ly/ws4v50IgXZ7 
When infections were at the highest level in the second wave (week ending 9 Jan 2021), the hospital admission rate was over three times higher, and the death rate involving #COVID19 was almost eight times higher than in the most recent week ow.ly/b2S450IgXOC 

• • •
Missing some Tweet in this thread? You can try to
force a refresh


