1/ Floor & Décor (FND)
Looking forward to the $FND analyst day on Wed 3/16. $FND, is a high-quality business compounding LT over 20%/yr. Shares are off -36% from 11/21 and I’m currently re-underwriting $FND for my portfolio. This thread discusses key items around the $FND model.
Looking forward to the $FND analyst day on Wed 3/16. $FND, is a high-quality business compounding LT over 20%/yr. Shares are off -36% from 11/21 and I’m currently re-underwriting $FND for my portfolio. This thread discusses key items around the $FND model.
2/Overview
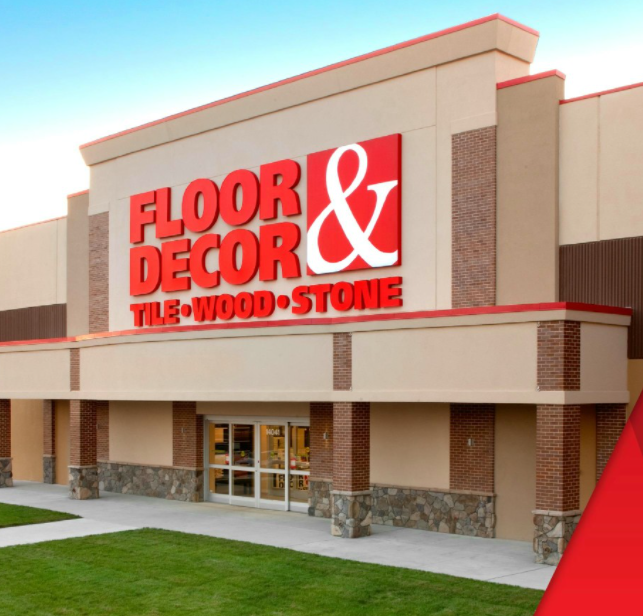
$FND is a specialty retailer that operates 160 large (~75k sq/ft) warehouse stores across 33 states selling tile, stone, wood, laminate, vinyl and other flooring products. Generated $3.4bln in ’21 revenue, $485mln in EBITDA (14.1% margin) and has a ~$10bln mkt cap
$FND is a specialty retailer that operates 160 large (~75k sq/ft) warehouse stores across 33 states selling tile, stone, wood, laminate, vinyl and other flooring products. Generated $3.4bln in ’21 revenue, $485mln in EBITDA (14.1% margin) and has a ~$10bln mkt cap
3/Comp Advantage [1]
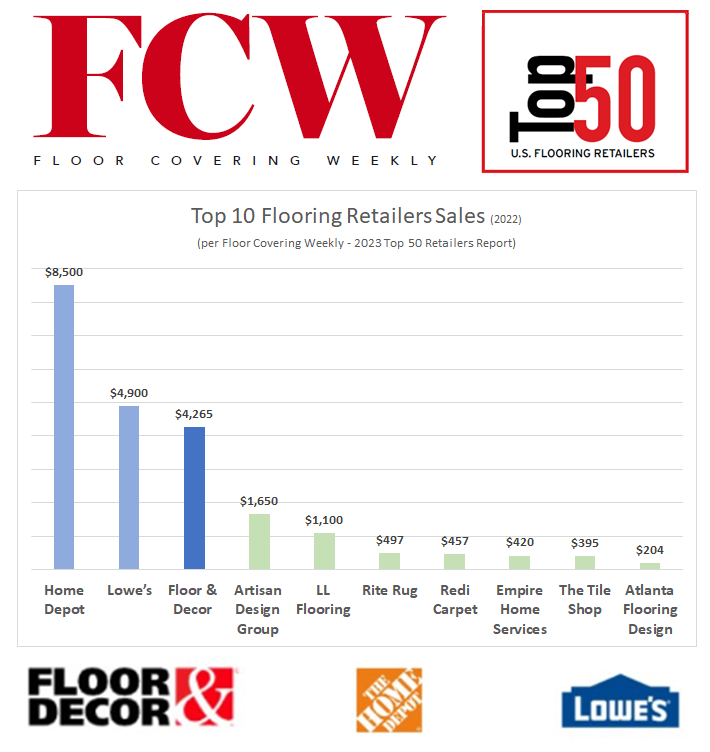
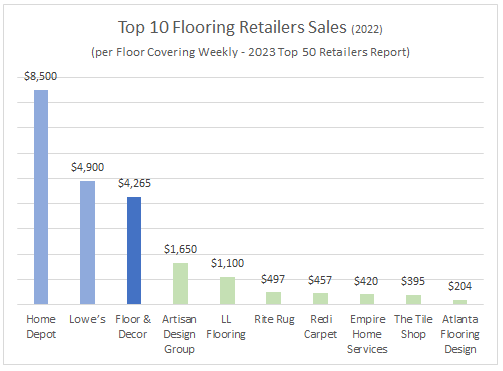
$FND primarily competes vs. home improvement centers ( $HD, $LOW, #Menards), specialty flooring ( $TTS), and local independents/mom & pops.
$FND has:
(1) larger box at ~75k sq/ft vs. $HD/ $LOW 3k-5k sq/ft flooring dept. and specialty/indep <20k avg. box
$FND primarily competes vs. home improvement centers ( $HD, $LOW, #Menards), specialty flooring ( $TTS), and local independents/mom & pops.
$FND has:
(1) larger box at ~75k sq/ft vs. $HD/ $LOW 3k-5k sq/ft flooring dept. and specialty/indep <20k avg. box
4/Comp Advantage [2]
(2) superior product breadth/depth and availability - $FND has >4k total SKU’s, many multiples of peers who have more limited assortments and lower store/regional level in stock quantities
(2) superior product breadth/depth and availability - $FND has >4k total SKU’s, many multiples of peers who have more limited assortments and lower store/regional level in stock quantities

5/Comp Advantage [3]
(3) scale - $FND regional DC’s, direct sourcing, and large size gives it superior economies of scale/purchasing scale
(4) low prices – $FND cuts out middlemen and intermediaries, goes direct to suppliers and passes through large cost savings to customers
(3) scale - $FND regional DC’s, direct sourcing, and large size gives it superior economies of scale/purchasing scale
(4) low prices – $FND cuts out middlemen and intermediaries, goes direct to suppliers and passes through large cost savings to customers

6/Unit Growth
$FND has grown its store base consistently at ~20%/yr. over ’13-’21 (except ’20- Covid) from 39 to 160 stores. Has an 8-10yr target of 500 stores (up from 400) by ‘29-‘31. Plans to grow units 20% in ’22 and at ~20%/yr. for the next “several years”.
$FND has grown its store base consistently at ~20%/yr. over ’13-’21 (except ’20- Covid) from 39 to 160 stores. Has an 8-10yr target of 500 stores (up from 400) by ‘29-‘31. Plans to grow units 20% in ’22 and at ~20%/yr. for the next “several years”.

7/Market Share Gains
$FND's superior scale, low prices, and ~20%/yr. unit growth is driving strong market share gains. $FND share has increased ~4x over '12-'21 from ~2% to ~8% as revenue grew ~30%/yr. ('12-'21), 3-5x industry growth.
$FND's superior scale, low prices, and ~20%/yr. unit growth is driving strong market share gains. $FND share has increased ~4x over '12-'21 from ~2% to ~8% as revenue grew ~30%/yr. ('12-'21), 3-5x industry growth.
8/Maturation
5yr new store maturation cycle. Go from $15mln of sales in yr1 to $26mln in yr5. MSD mature comps. Store EBITDA margins ramp from 17% in yr1 to 25% in yr5. With $9mln in initial investment, $FND achieves a 2.5yr pre-tax payback with 50% cash on cash returns by yr3
5yr new store maturation cycle. Go from $15mln of sales in yr1 to $26mln in yr5. MSD mature comps. Store EBITDA margins ramp from 17% in yr1 to 25% in yr5. With $9mln in initial investment, $FND achieves a 2.5yr pre-tax payback with 50% cash on cash returns by yr3

9/Comp Waterfall
$FND store maturation drives consistent strength in same store sales. New stores ramping from yr1-yr5 sales of $15mln to $26mln equates to a 15%/yr CAGR for new stores. Over ’13-’21 realized on a consolidated basis ~15%/yr in avg quarterly same store sales comps
$FND store maturation drives consistent strength in same store sales. New stores ramping from yr1-yr5 sales of $15mln to $26mln equates to a 15%/yr CAGR for new stores. Over ’13-’21 realized on a consolidated basis ~15%/yr in avg quarterly same store sales comps

10/Vintages
$FND store base still has >50% of stores <5yrs old. 20%-unit growth constantly replenishes stores reaching maturity (5yr) allowing for a stable mix of mature vs. new stores. This allows $FND to sustain its comp waterfall drop through to consolidated same store sales
$FND store base still has >50% of stores <5yrs old. 20%-unit growth constantly replenishes stores reaching maturity (5yr) allowing for a stable mix of mature vs. new stores. This allows $FND to sustain its comp waterfall drop through to consolidated same store sales

11/Mature
Mature stores have 25% EBITDA store level margins. $FND has 2.5%/sales in other supply chain costs and 4% in corp exp. Foots to 18.5% mature margins. Less 3% in D&A equals 15% op margins. vs. ’21 EBITDA margins of 14% & op margins of 10% $FND has large LT margin upside
Mature stores have 25% EBITDA store level margins. $FND has 2.5%/sales in other supply chain costs and 4% in corp exp. Foots to 18.5% mature margins. Less 3% in D&A equals 15% op margins. vs. ’21 EBITDA margins of 14% & op margins of 10% $FND has large LT margin upside

12/Self-Funding
CFO largely covers required CAPEX to sustain 20%-unit growth. $FND on avg spends 3% on maint CAPEX and 6-9% on new stores. Sums to 10-13% CAPEX/sales vs. 12-13% CFO margins (12% ’21,13% ’22e). CAPEX/sales is increasing via shift to more owned vs. leased stores
CFO largely covers required CAPEX to sustain 20%-unit growth. $FND on avg spends 3% on maint CAPEX and 6-9% on new stores. Sums to 10-13% CAPEX/sales vs. 12-13% CFO margins (12% ’21,13% ’22e). CAPEX/sales is increasing via shift to more owned vs. leased stores

13/ROIC
$FND has solid pre-tax lease adj (22% ’21) and non-lease adj (27% ’21) #ROIC’s with after-tax lease adj (17% ‘21) and non-lease adj (21% ’21) #ROIC. These are diluted by new stores. At maturity pre-tax lease adj. (28%) and non-lease adj. (38%) ROIC would be 5-11% higher
$FND has solid pre-tax lease adj (22% ’21) and non-lease adj (27% ’21) #ROIC’s with after-tax lease adj (17% ‘21) and non-lease adj (21% ’21) #ROIC. These are diluted by new stores. At maturity pre-tax lease adj. (28%) and non-lease adj. (38%) ROIC would be 5-11% higher
14/Growth Algorithm
Effectively $FND can recycle ~100% of CFO back into the business at well over >20% ROIC’s. $FND’s guided growth algorithm is 20%/yr. unit growth (over the next “several yrs”) + op leverage = ~25%/yr. profit growth (on a 3yr CAGR basis).
Effectively $FND can recycle ~100% of CFO back into the business at well over >20% ROIC’s. $FND’s guided growth algorithm is 20%/yr. unit growth (over the next “several yrs”) + op leverage = ~25%/yr. profit growth (on a 3yr CAGR basis).
15/ Management
At the helm of $FND is CEO Tom Taylor who is an ex $HD alumni. Tom worked at $HD since he was 16 and worked his way up over a 23yr career to eventually serve as EVP of ops and merchandising for 2,200 stores. Left for PE in 2006 and joined $FND in 2012.
At the helm of $FND is CEO Tom Taylor who is an ex $HD alumni. Tom worked at $HD since he was 16 and worked his way up over a 23yr career to eventually serve as EVP of ops and merchandising for 2,200 stores. Left for PE in 2006 and joined $FND in 2012.
16/Supply Chain (SC)
Global SC constraints negatively impacted $FND gross margins in 2H’21 which declined -124bps in ’21 (Q3’21 -135bps, Q4’21 -372bps). Mgmt. expects continued pressure into 1H’21 (guide -331bps Q1’22) with gross margins exiting ’22 at ~41% (’21 41.4%).
Global SC constraints negatively impacted $FND gross margins in 2H’21 which declined -124bps in ’21 (Q3’21 -135bps, Q4’21 -372bps). Mgmt. expects continued pressure into 1H’21 (guide -331bps Q1’22) with gross margins exiting ’22 at ~41% (’21 41.4%).
17/Valuation
$FND shares have declined -36% off Nov/’21 highs on both supply chain issues and the current Russia/Ukraine conflict. $FND now trades at ~16x NTM EBITDA (~27x in Nov/21) with multiples back to pre-covid levels seen in ’18-’19.
$FND shares have declined -36% off Nov/’21 highs on both supply chain issues and the current Russia/Ukraine conflict. $FND now trades at ~16x NTM EBITDA (~27x in Nov/21) with multiples back to pre-covid levels seen in ’18-’19.

18/End
Overall, $FND is a high-quality business with a long growth runway. Near term supply chain, geopolitical, and recession concerns have weighted on $FND shares. More to follow after $FND’s investor day.
Overall, $FND is a high-quality business with a long growth runway. Near term supply chain, geopolitical, and recession concerns have weighted on $FND shares. More to follow after $FND’s investor day.
• • •
Missing some Tweet in this thread? You can try to
force a refresh