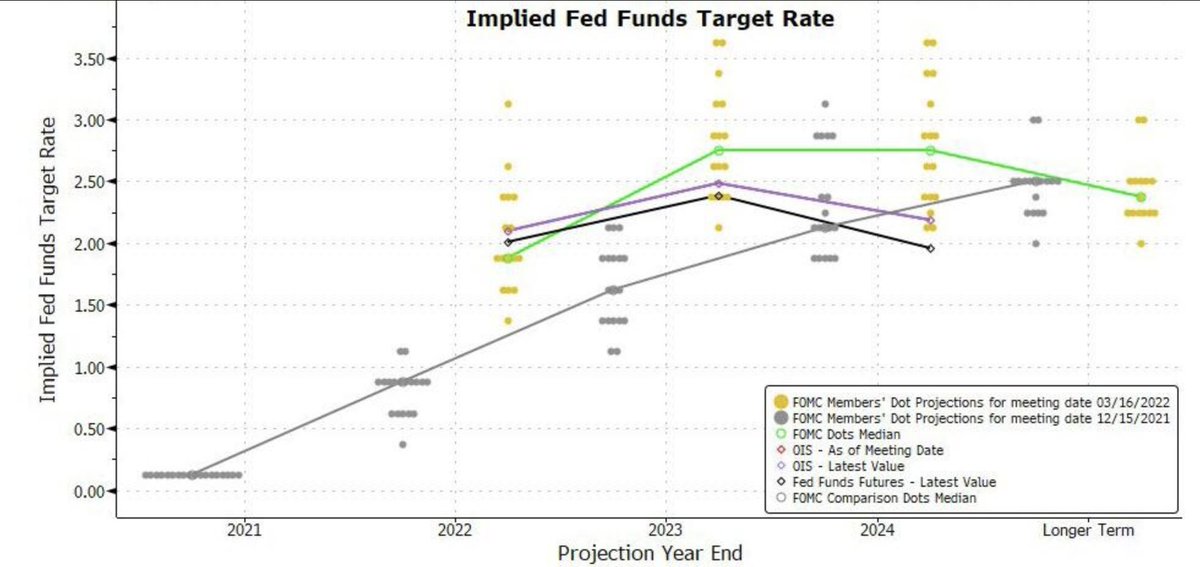
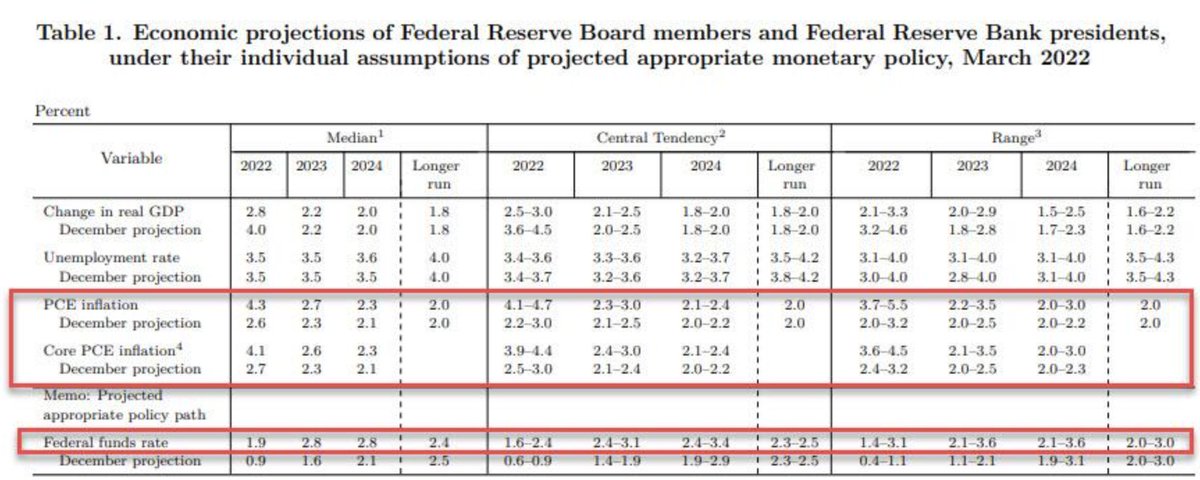
1/ Markets were expecting 25bps hike, likely some hawkish guidance to get back some credibility (good luck!), higher dot plot to meet the market pricing and QT guidance. Well we got the higher dots...
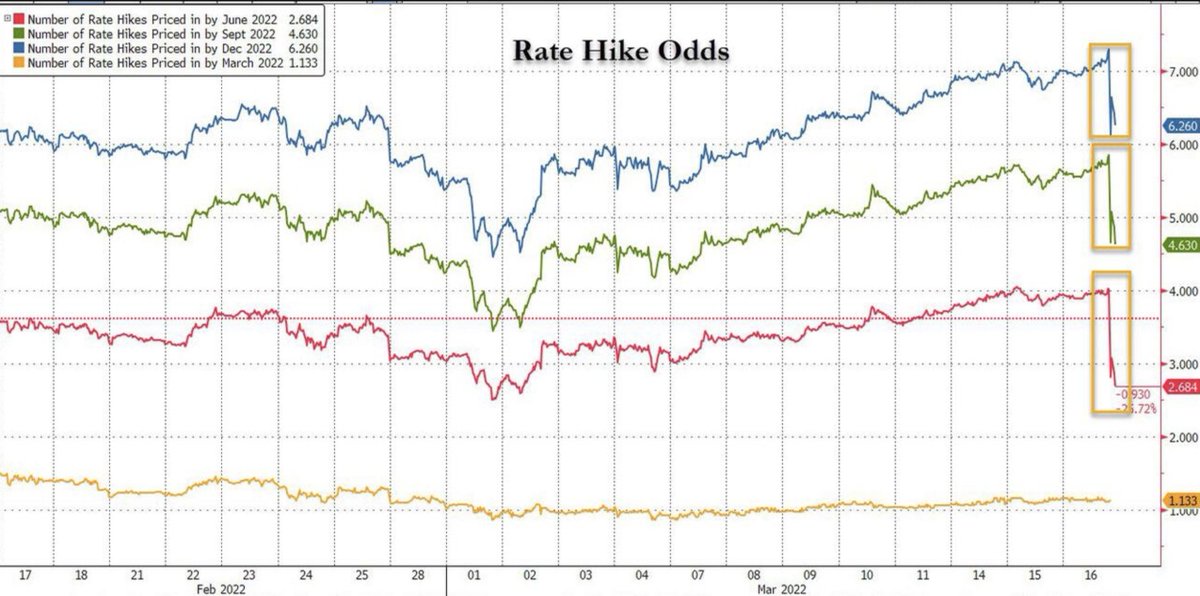
2/ Markets however decided that confirmation of hiking at every meeting this year was reason to be concerned, given just how bad the FED have been at predicting inflation dynamics. Hike probabilities for this year actually came down. Sell the news!
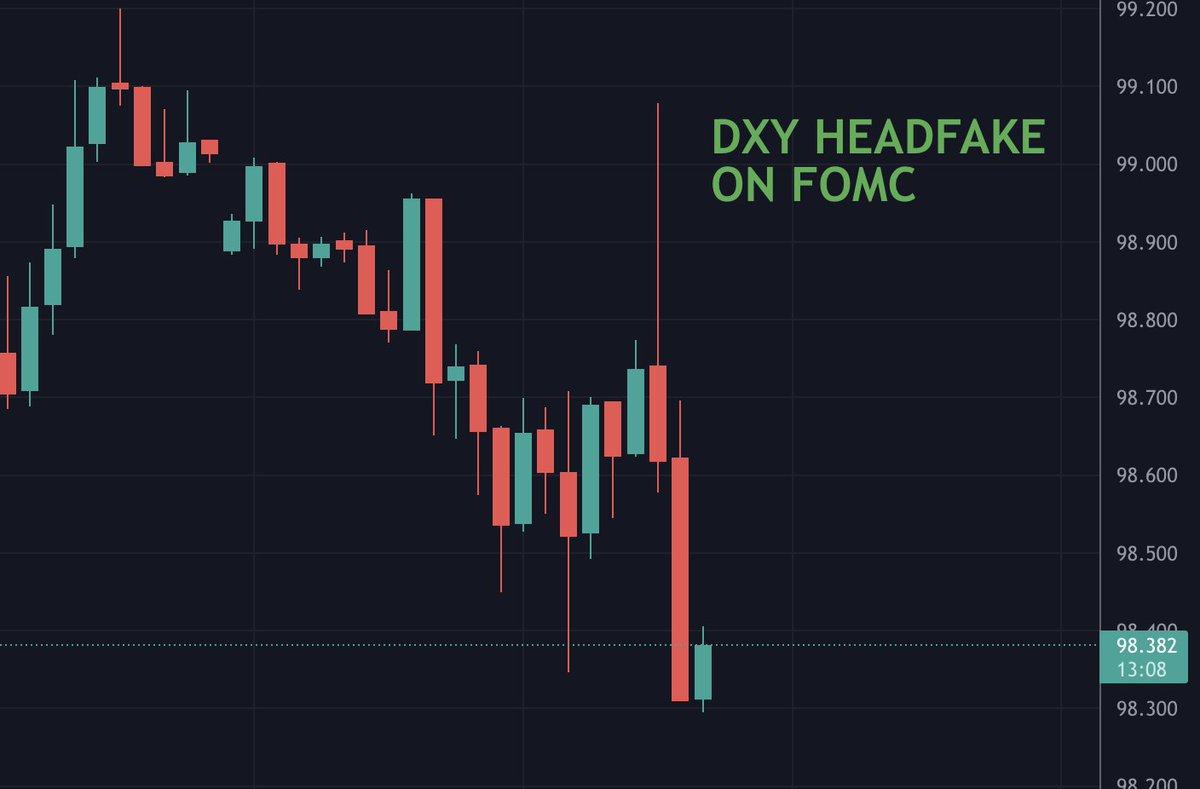
3/ This dovish move in short rates after the presser along with 5s10s inverting triggered "risk on" across asset classes with DXY lower, stocks, gold and crypto higher.
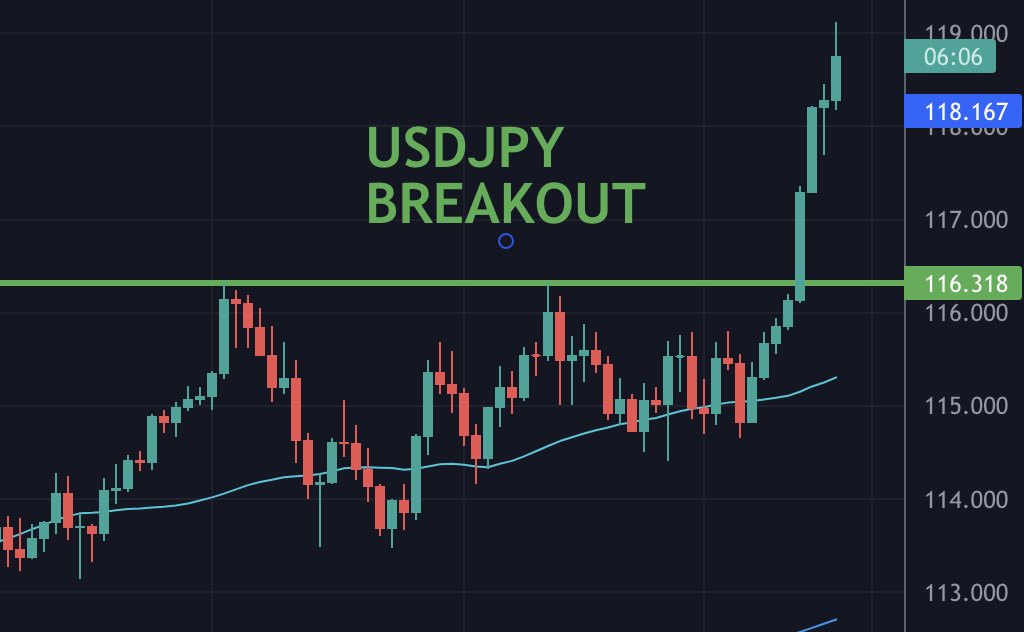
4/ USDJPY recent breakout on Kuroda ruling out hikes this week. This could have some legs as CB policies diverge so dramatically.
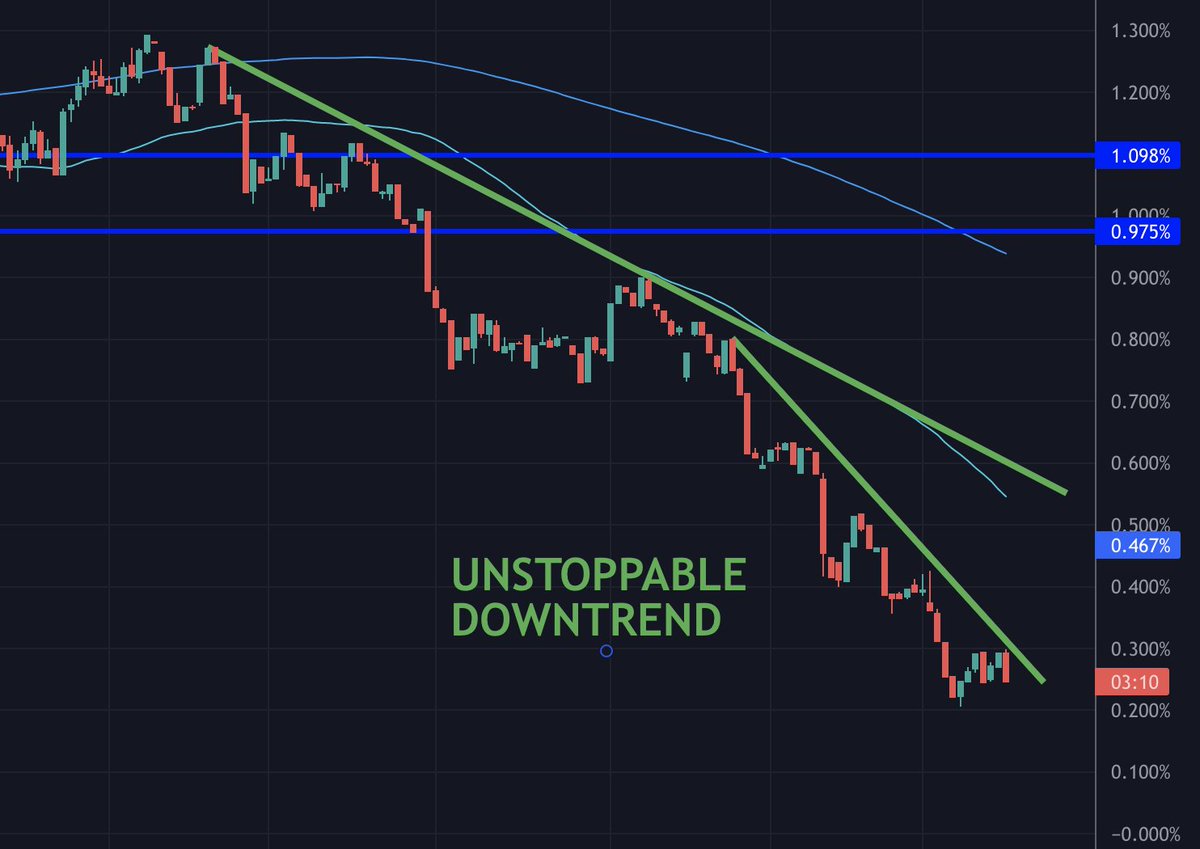
5/ The unstoppable trend of yield curve flattening continued with 2s10s flatter by 5bps to 25 bps. Not much wiggle room before we see an inversion which many will call a recession signal.
6/ These type of whipsaw moves on FOMC day are quite normal and often it's more about positioning than the actual fundamentals. Overall, Powell confirmed stagflation risk is high, market decided to rally. Lower growth, higher inflation, not a great combination.
7/ If you like this thread pls RT and be sure to try out our community by joining our FREE Discord group chat (discord.com/invite/dsnhDWS…) to join the conversation and get info like this & more in real-time.
• • •
Missing some Tweet in this thread? You can try to
force a refresh
For those of you who follow the SPX Vol surface, you will know that SKEW is quite pumped right now. It's still around the 80th percentile after getting hit yesterday.
So does that make it a sell still?
Not necessarily. Because there is a reason why SKEW is expensive. And that reason is that people are willing to pay for VANNA.
So, what the hell is VANNA? Explainer🧵
1/ Vanna is a second-order Greek that represents two things at once. It represents how your VEGA position changes when the underlying spot moves. But it also represents how your DELTA changes when implied volatility moves.
I like to think of it as your realised skew exposure, just like gamma is your realised volatility exposure.
2/ Let's take an example where you have a Vanna position of $100k of Vega per 1% spot change. And you are long downside puts and short upside calls.
You will therefore also have a delta change per implied vol change of $10 million DELTA per 1% vol change.
As the market goes down, you will get longer Vega. If the market goes up, you will get shorter Vega.
And as implied vol goes up, you will get shorter delta. And if implied vol goes down, you will get longer delta.
I saw a reddit post about dispersion today written by a quant. It was pretty good but I feel like the target audience was vol professionals and most people wouldn't have a clue what he was on about.
So here goes....the Options Insight explanation of the famous Dispersion Trade explained in plain English...
Let's imagine the stock market is a choir🧵
1/ The Index (SPX) is the whole choir singing together.
The stocks are the individual singers.
Dispersion trading is about betting on how in-sync the singers are with each other.
2/
If every singer hits the same note perfectly → the choir sounds loud and clear → the SPX moves a lot.
If everyone sings their own tune → the choir sounds softer, even if each singer is loud → SPX goes nowhere.
Perfect sync = high correlation
Everyone doing their own thing = low correlation/high dispersion
Why do YOU need our daily SPX fixed strike vol monitor?
1/ There are so many GEX models out there, saying different things, with different embedded assumptions. For example, @t1alpha suggest that SPX dealers have just flipped short gamma...
2/ But GS see a very different profile, which seems to include a lot of very short dated local gamma supply. This means dealers lose gamma in both directions.
3/ And finally Nomura's well followed @CharlieMcEllig1 and team said recently that the setup is the complete reverse with dealers short upside around the 5000 strike.
Let's dive into last week's options trading insights! Remember, the full details are included in our site weekly blog post (check my profile's linktree).
1/ We saw signs that SPX buying flows might slow down after Friday's OPEX. SPX hasn't dipped, likely buoyed by these Jan OPEX positions, especailly in Mag7 names.
Protecting your US index exposure with Feb24 or Mar24 put spreads makes sense. Post-Jan OPEX, expect less market support due to the fading effect of CHARM and buyback blackouts for earnings.
This creates a chance for tactical shorts in the coming weeks. Our evidence suggests that SPX's end-of-day buying is due to dealers hedging DELTA on Jan24 long GAMMA positions.
According to GS, dealer GAMMA has collapsed, making the markets less stable as we head into mega-cap tech earnings...
2/ We also think it's time to consider VIX call spreads.
Why? The chances of a volatility spike seem higher now. There's been a surge in Feb24 17 calls, pushing VVIX up. This aligns with our observation of increased equity vol. Investors are hedging risks, a sign of market nervousness.
19Jan24 fixed strike vol dropped, but Feb24 and Mar24 firmed up. This indicates dealers covering short-term VEGA from VIX trades.
Even if SPX tests 5000, VIX is unlikely to drop < 12. as VIX beta drops on the way up.
We're buying VIX call spreads to capitalize on the potential vol spike. This approach offers leverage while controlling THETA bleed.
1/ As SPX rips back to its highs, we see breadth deteriorating as the Mag7 are leading the charge once again.
2/ The options flows also back up this move as lots of calls were bought in the Mag7 names, which went deeply in the money and the CHARM effect of these options becoming 100 delta leads to more stock buying. Here is $MSFT 19Jan open interest, but looks the same for $NVDA, $AMZN, etc.
Are options really that risky? Or do you just not know how to size them properly?
This is a common pushback I get from people about options, saying they are way too risky and you can lose all you money trading them.
A thread...
1/ The truth is, yes they can be risky if you don’t know what you’re doing.
If you know how to size them appropriately, then options can seriously enhance you risk-adjusted return profile and allow you to profit from multiple scenarios.
2/ Example 1 - How not to do it - YOLO
You want to speculate on a stock going up because it has a strong trend and the Santa rally is coming. So you buy a 1-week OTM call with 10% of your account capital.