1/Floor & Décor Investor Day
$FND's investor day was yesterday. Continue to be impressed by this early-stage category killer. Strong execution and one of the better names in my portfolio.
For a quick walk through see this thread
Below are some notes
$FND's investor day was yesterday. Continue to be impressed by this early-stage category killer. Strong execution and one of the better names in my portfolio.
For a quick walk through see this thread
https://twitter.com/EquiCompound/status/1502734216773218312?s=20&t=xJZH4Yc-BwT5-Avxvv3SEQ
Below are some notes
2/Retail Conversion Rate
Homeowner customers that shop at $FND ultimately purchase over >80% of the time. Professional customers that shop at $FND purchase over >90% of the time. Pretty impressive. Average brick and mortar retail conversion rates are 20%-40% for most retailers
Homeowner customers that shop at $FND ultimately purchase over >80% of the time. Professional customers that shop at $FND purchase over >90% of the time. Pretty impressive. Average brick and mortar retail conversion rates are 20%-40% for most retailers
3/Sq/Ft
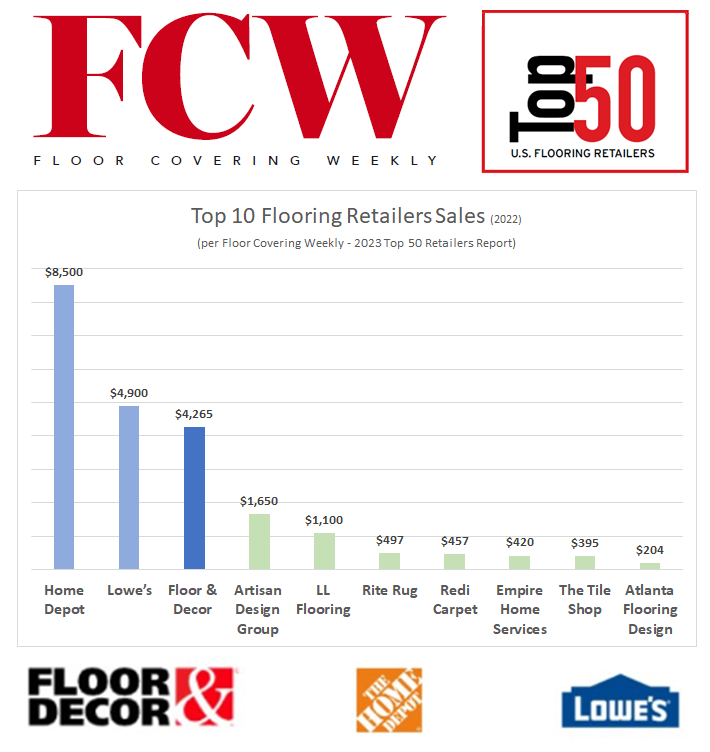
$FND has more flooring dedicated sq/ft coverage than any other operator. Has 12.6mln sq/ft vs. $HD's ~8.0mln and $LOW's ~6.9mln flooring dept sq/ft (est @ 4k sq/ft store). Almost exceeds both combined and dwarfs all others on a total sq/ft basis and on a box vs. box basis
$FND has more flooring dedicated sq/ft coverage than any other operator. Has 12.6mln sq/ft vs. $HD's ~8.0mln and $LOW's ~6.9mln flooring dept sq/ft (est @ 4k sq/ft store). Almost exceeds both combined and dwarfs all others on a total sq/ft basis and on a box vs. box basis

4/SKU Comparison
$FND updated it’s SKU count comparisons vs. peers. Assortment breadth/depth vs. peers continues to increase with both substantially higher in-stock SKU’s and total available SKUs (special order) vs. competitors.
$FND updated it’s SKU count comparisons vs. peers. Assortment breadth/depth vs. peers continues to increase with both substantially higher in-stock SKU’s and total available SKUs (special order) vs. competitors.

5/Micro-Merchandising
$FND noted each market and each store within a market have product assortments that are fully tailored based on local market preferences. Difficult to emulate as it requires large total SKU breadth/depth to drive enough variation in local assortments
$FND noted each market and each store within a market have product assortments that are fully tailored based on local market preferences. Difficult to emulate as it requires large total SKU breadth/depth to drive enough variation in local assortments

6/Supply Chain
$FND made wise moves 5yrs ago by setting up dedicated LT agreements with ocean carriers. Has insured continuity of supply and kept $FND off spot markets. Last 3yrs $FND has also been using more dedicated truck fleets. Both help sustain a better inventory position
$FND made wise moves 5yrs ago by setting up dedicated LT agreements with ocean carriers. Has insured continuity of supply and kept $FND off spot markets. Last 3yrs $FND has also been using more dedicated truck fleets. Both help sustain a better inventory position
7/Supply Chain- China
$FND sources ~30% of products sold from suppliers in China with it's largest supplier (17%) in the country. Mgmt noted factories for these are located outside of major city centers and $FND has not seen any issues YET with the current China COVID situation
$FND sources ~30% of products sold from suppliers in China with it's largest supplier (17%) in the country. Mgmt noted factories for these are located outside of major city centers and $FND has not seen any issues YET with the current China COVID situation

8/Demand
$FND customers are in a strong position. >$7tln of home equity has been added since Q1'19. Mid/upper income homeowners also have seen bank accounts increase $3.5tln over past few years. Coupled with 80% of housing stock >20yrs old provides a backdrop for continued demand
$FND customers are in a strong position. >$7tln of home equity has been added since Q1'19. Mid/upper income homeowners also have seen bank accounts increase $3.5tln over past few years. Coupled with 80% of housing stock >20yrs old provides a backdrop for continued demand

9/Pricing
$FND price variance vs. peers is large, often 30-50% lower. Gross margin has come under pressure due to supply chain/inflation. $FND is lagging pricing to take share. Mgmt intends to recoup lost gross margin via modest price increases over the next few years ('23-'24)
$FND price variance vs. peers is large, often 30-50% lower. Gross margin has come under pressure due to supply chain/inflation. $FND is lagging pricing to take share. Mgmt intends to recoup lost gross margin via modest price increases over the next few years ('23-'24)
10/'22-'24 Guidance
$FND guided for '22-'24 +20%/yr unit growth, "at least" +20%/yr revenue growth, and EBIT to double vs. ’21 (+25%/yr). Sees EBITDA margins in the “mid-teens” (15% vs ’21 14.1%). Mgmt. noted during the presentation that revenue guidance was conservative.
$FND guided for '22-'24 +20%/yr unit growth, "at least" +20%/yr revenue growth, and EBIT to double vs. ’21 (+25%/yr). Sees EBITDA margins in the “mid-teens” (15% vs ’21 14.1%). Mgmt. noted during the presentation that revenue guidance was conservative.

11/Long Term Opportunity
$FND sees the co. being at least 5x its current size long term. Targets 500 stores in 8-10yrs (’21 160) via 20%/yr. unit growth for the time being. Targets a mid-teens EBITDA margin while growing units 20%/yr. with an upper teens LT mature EBITDA margin
$FND sees the co. being at least 5x its current size long term. Targets 500 stores in 8-10yrs (’21 160) via 20%/yr. unit growth for the time being. Targets a mid-teens EBITDA margin while growing units 20%/yr. with an upper teens LT mature EBITDA margin

12/End
Came away from the investor day with my investment thesis and LT model confirmed for $FND. This is a business with a long runway that can grow at >20%/yr. While near term margin and macro issues have weighed on shares the LT investment opportunity for $FND appears intact
Came away from the investor day with my investment thesis and LT model confirmed for $FND. This is a business with a long runway that can grow at >20%/yr. While near term margin and macro issues have weighed on shares the LT investment opportunity for $FND appears intact

• • •
Missing some Tweet in this thread? You can try to
force a refresh


