Some odd results in replicating latest Scafetta effort. I added the uncertainty on the observational temperature difference, and included all ensemble members for which I have an ECS (everyone except FIO-ESM-2). @micefearboggis@GarethSJones1#CMIP6
Note that there are many ensemble members that have temperature differences smaller than the ERA5 value with ECS > 3. None of which appear in Scafetta's figure.🧐🧐🧐
Possibly just a function of the automatic ensemble member selection when downloading from ClimExp?
Regardless, Scafetta's claim that only models with ECS<3ºC are compatible with ERA5 is patently wrong.
Constraints based on recent trends only preclude the really high ECS models (> 5ºC), see work by @kasia_tokarska for better analyses of this.
Plotting the 1st ensemble member for each model, I get closer to Scafetta's distribution (some minor diffs in estimated ECS have an impact).
However, his conclusion still relies on ignoring the uncertainty in the obs & falls apart completely when all ensemble members are used.
• • •
Missing some Tweet in this thread? You can try to
force a refresh
Similarly, I was discussing batteries with a physics professor last week, and he insisted that there has been effectively no progress in large scale storage.
But actually there has. First off, prices for Li-ion batteries have decreased by a factor of 25(!) since the 1990s.
The claim then switched to how energy density wasn't changing because of 'fundamental physical constraints'... except that isn't true either. Maximum Li-ion energy density has increased by more than a factor of 3.
This particular episode revolves around the Greenland Ice Sheet which has been losing roughly 275 Gt/yr of ice for the last 20 years. climate.nasa.gov/vital-signs/ic…
But there is substantial year-to-year variability, so not every year is worse than the year before. 2012 and 2019 were noticeably bad years for ice loss, but 2013 and 2018 weren't as bad.
We see this with all of the anti-science bad faith arguments. Regardless of how often people have pointed out how silly it is, or that it makes no logical sense, or that there would be no motive to doing something like that, the smugs will continue to make it.
The ingredients are simple. A name, an unexamined difference, an imputation of misconduct. Because remember, it's not enough to just argue about what should be done, the problem itself must not exist, or is being hyped by (((folks))). The 2-minute hate needs to be personalized.
[Aside, I'm used to it being me sometimes - I put it down to the "internet doppelganger" effect. Someone who gets talked about online who has your name and work, but instead is the worst person in the world.]
The potentially record-shattering extreme heat weather forecasts for the Pacific NW are pretty shocking, but some folks keep getting the climate change connection wrong.
He states as a supposed ‘golden rule’ that “the bigger the temperature extreme the SMALLER the contribution of global warming”. This is nonsense - but it’s worth thinking about why.
You know how some folk like to use a graph with the GEOCARB model estimates of CO2 over the last 500 million years and a hand drawn estimate of temperature to claim that CO2 doesn’t influence climate?
Yes, that’s the one:
Well, the latest version of the same GEOCARB model (which has significantly more functionality & processes), has been used with the latest CO2 & temperature reconstructions to actually constrain the climate sensitivity. And guess what they get?
People have been making the (valid) point that climate variability still exists even after we reach net-zero carbon emissions. This can also be turned around: how close to net-zero do you need to get to no longer be able to detect temperature trends?
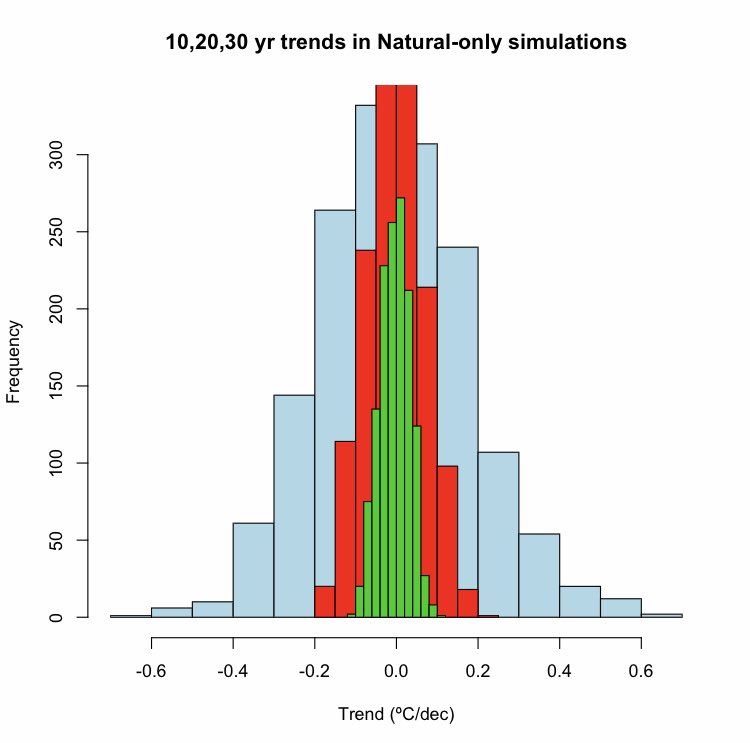
An estimate of natural variability at different periods can be derived from natural-forcing-only historical runs (includes volcanoes/solar etc). The 95% confidence intervals on the spread is 0.35, 0.14, 0.07°C/dec for 10, 20 & 30 yr trends respectively.
Roughly the current rate of temperature rise (~0.2°C/dec) corresponds to 10GtC/yr emissions. This is easily detectable in 20yr trends (but not over a 10yr period). But if we reduce emissions by 90%, the expected trend would be ~0.02°C/dec, which is not detectable even over 30yrs!