Jeff Gilchrist Profile picture
Mar 29, 2022 19 tweets 4 min read Read on X
COVID-19: Causes unprecedented autoimmunity

Several studies have shown indicators and markers of autoimmunity (immune response attacking body's own health cells or tissues) present with and after COVID-19 infection. 🧵1/
One study found that CD8+ T-cells expressing killer cell immunoglobulin-like receptors (KIRs) are increased in the blood and inflamed tissues of patients with a variety of autoimmune diseases, including COVID-19 ( science.org/doi/10.1126/sc… ). 2/
They found elevated levels of KIR+CD8+ T-cells but not CD4+ regulatory T-cells in COVID-19 patients which correlated with disease severity, vasculitis (inflammation of blood vessels) and were associated with autoimmune-related complications. 3/
Their results indicate that these regulatory CD8+ T-cells act uniquely to suppress pathogenic T-cells in autoimmune and infectious diseases. When they destroyed these cells in virus infected mice, it led to autoimmunity post-infection. 4/
Another study looked at 147 hospitalized COVID-19 patients and found autoantibodies in 50% of patients but less than 15% of healthy controls ( nature.com/articles/s4146… ).  Autoantibodies mistakenly target and react with a person's own tissues or organs. 5/
They hypothesize that prolonged inability to eradicate and clear the virus expands the adaptive immune response to target non-structural viral proteins, some of which might physically interact or cross-react with components of the body. 6/
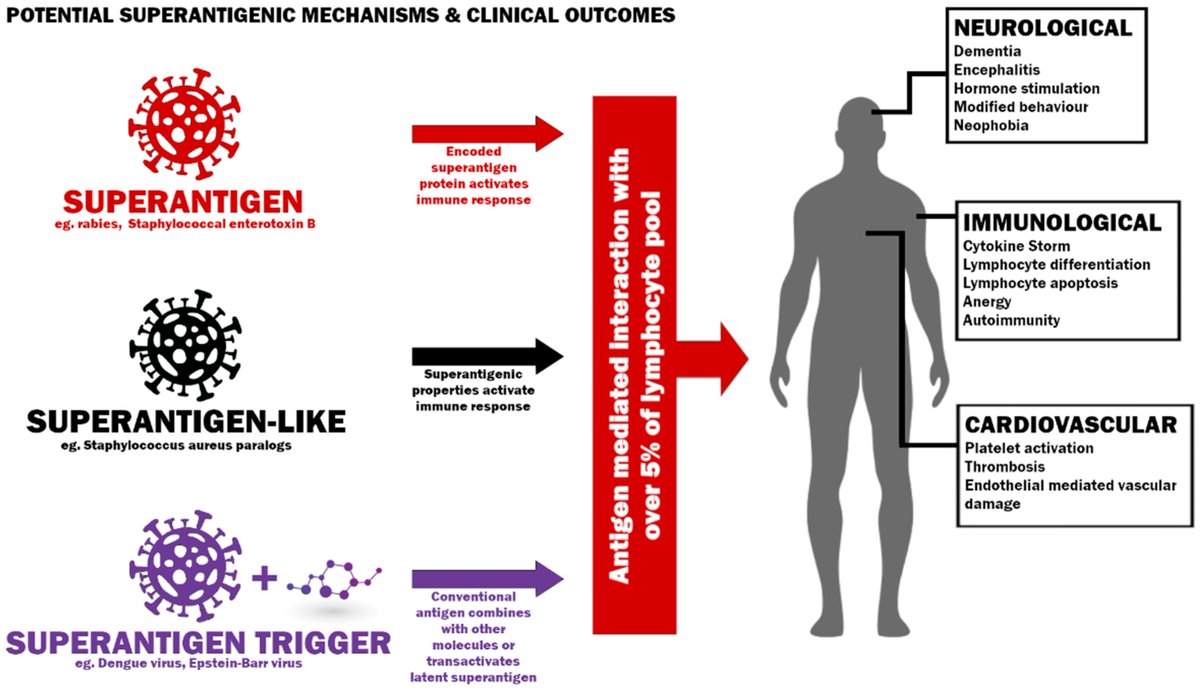
A new publication from @fitterhappierAJ discusses superantigens and COVID-19 ( mdpi.com/2076-0817/11/4… ).  It has been suggested that the COVID-19 virus contains at least one superantigen-like pattern that is unique and not found in any other SARS or endemic coronaviruses. 7/
Why is this an issue? Superantigens can send the immune system into overdrive since multiple immune cells already trained for other pathogens might think it looks similar enough and activate. Normally a very small fraction of T-cells will be stimulated during an infection. 8/
A superantigen can stimulate up to 30% of naive T-cells which can also lead to a number of issues including anergy (T-cells become unresponsive), inflammation, cytotoxicity (kill cells), deletion of T-cells, and autoimmunity. 9/
"SARS-CoV-2 causes many of the biological and clinical consequences of a superantigen, and we believe in the context of reinfection and waning immunity,..." 10/
"... it is important to better understand the impact of a widely circulating, airborne pathogen that may be a superantigen, superantigen-like or trigger a superantigenic host response." 11/
Superantigens have differing effects on immature and mature CD4 and CD8 T-cells (see figure).  They can deplete immature T-cells but hyperstimulate mature cells.  12/
They can also cause differentiation of naive T-cells and stimulation of CD8 memory cells from bystander activation which can also lead to T-cell death. 13/ Image
The possibility of deletion of antiviral memory warrants investigation given the thymus loses its ability to produce new naive T-cells as we age and could compromise the ability for the immune system to clear pathogens. 14/
COVID-19 has been found to persist in the body for months after infection therefore chronic exposure to superantigen could continually stimulate T-cells, keeping them in a perpetual state between anergy and hyperstimulation.  15/
This could also manifest in an observed naive T-cell depletion and could explain the low quantities found in some Long COVID patients. 16/
The evidence of autoimmunity with COVID-19 keeps mounting. Studies have found immunological dysfunction following even mild to moderate infection, including depletion of naive T-cells and B-cells in individuals with Long COVID. 17/
Another study found the depletion of naive T-cells and higher levels of T-cell death (apoptosis) in COVID-19 infection than HIV. 18/
"Some countries seem willing to tolerate high levels of infection provided their healthcare systems can cope... If SARS-CoV-2 contains a superantigen, superantigen-like protein or triggers a superantigenic host response, this strategy may prove a grave error." 19/

• • •

Missing some Tweet in this thread? You can try to force a refresh
 

Keep Current with Jeff Gilchrist

Jeff Gilchrist Profile picture

Stay in touch and get notified when new unrolls are available from this author!

Read all threads

This Thread may be Removed Anytime!

PDF

Twitter may remove this content at anytime! Save it as PDF for later use!

Try unrolling a thread yourself!

how to unroll video
  1. Follow @ThreadReaderApp to mention us!

  2. From a Twitter thread mention us with a keyword "unroll"
@threadreaderapp unroll

Practice here first or read more on our help page!

More from @jeffgilchrist

Jan 11
*** Ontario Virus & Variant Update | Jan 11 ***

Hospitalizations due to COVID increased from 176 to 241 in the last update. Influenza hospitalizations have start dropping from the peak of 1,400 to 1,095 with RSV increasing from 121 to 156. 🧵1/ Graph of New hospitalizations in Ontario due to COVID, Influenza or RSV.
Looking back over the past few years, new hospitalizations for RSV have remained pretty stable the last two years around 2,500 and a decrease from 2023, while COVID has been significantly dropping each year, 26,571 in 2023 to 15,739 in 2024 to 6,788 in 2025. 2/ Graph of New hospitalizations in Ontario due to COVID, Influenza or RSV, grouped by calendar year.
Influenza has been doing the opposite, increasing significantly each year from 3,486, to 4,380 in 2024, to 12,818 in 2025. 3/
Read 13 tweets
Oct 25, 2025
How does various mask fit compare to filter the air and protect you or others?

Most masks, even baggy blue procedure masks use filtering material that can filter 95%+ of particles that pass through it, but the key is "pass through it". 🧵1/ Bar chart titled “Equivalent Exposure Time to Unmasked Person.” The chart compares how long different masks/respirators extend the equivalent exposure time relative to being unmasked. The x-axis shows unmasked infection times of 1, 5, and 10 minutes. The y-axis shows equivalent masked exposure time, ranging up to 5000 minutes. Seven mask types are represented by colored bars: - Procedure mask (loose fit, FF=2) - Ear loop mask (tight fit, FF=6) - Vertical bifold headband mask (FF=30) - N95 headband masks with fit factors of 100, 200, and 500 Key pattern: higher fit factor masks dramatically ...
Protection mostly depends on how well that mask fits your specific face and one that does not fit well, much of the air you breathe will go around the filter material and filter 0% of those particles. 2/
There has been a chart going around recently that talks about "Time it takes to transmit an infectious dose of COVID-19" which is misleading if you don't understand all of the details of how that table was made and what each component means. 3/
Read 25 tweets
Oct 19, 2025
** Ontario Variant Update (to Oct. 3, 2025) **

The XFG.* "Stratus" family is accounting for 83% while the next closest variant family NB.1.8.1.* "Nimbus" is 12.8% of sequenced genomes from COVID tests. 🧵1/ Line graph showing COVID-19 variant family frequencies in Ontario, Canada, from June to October 2025, based on 3,722 sequenced genomes.
Looking at specific variants, XFG.3 has dropped considerably and its descendent XFG.3.15 now takes first place at 6.2%, followed by XFG.3 at 5.2% and XFG.2 at 4.5%. 2/ Line graph showing specific COVID-19 variant frequencies in Ontario, Canada, from June to October 2025, based on 3,722 sequenced genomes.
It looks like PY.1.1.1 was trying to make a run for the top in mid-September but has decreased significantly. PY.1.1.1 is a descendant of LF.7 while the XFG variant is a recombination of LF.7 and LP.8.1.2 so they would share some mutations in common. 3/
Read 10 tweets
Sep 9, 2025
*** Ontario Variant Update (to: Aug. 16, 2025) ***

Ontario COVID sequence updates have been more frequent over the past month with the XFG.* "Stratus" family of variants now at 74% of sequences, NB.1.8.1.* "Nimbus" at 22% and LP.8.1.* down to 3%. #Variants #XFG #Stratus 🧵1/ Line graph showing COVID-19 variant frequencies in Ontario, Canada, from May to mid August 2025, based on 1,772 sequenced genomes. The XFG.* Stratus variant rises sharply to dominate over 70% by August. Other variants, including FLiRT and LP.8.1.*, decline over the same period, while NB.1.8.1.* Nimbus remains steady around 20% and several minor variants remain at low levels.
Looking at specific variants as of mid August, XFG.5.1 is most prevalent at 13%, NB.1.8.1 in second at 10%, XFG.2 in third at 8.6% and XFG.3 in fourth at 7.4%. 2/ Line graph showing COVID-19 variant frequencies in Ontario from 5 July to 16 August 2025, based on 750 sequenced genomes. Seven variants are tracked: NB.1.8.1, XFG.2, XFG.3, XFG.3.4.1, XFG.3.1, XFG.4.1, and XFG.5.1. Frequencies range from 0% to about 14%, with some variants rising, others falling, and some fluctuating over time. A bar chart below shows the number of samples collected on each date.
LP.8.1 is what this fall's Japan Novavax vaccine and the mRNA vaccines are designed for which is now almost gone and typical of how these things work with vaccine manufacturing timing while Novavax is providing the previous year's JN.1 vaccine formula for the USA again. 3/
Read 18 tweets
Jun 9, 2025
Understanding Canadian Air Quality Health Index (AQHI) & Wildfire Smoke

Wildfire smoke consists of toxic gases and particulate matter (PM) when breathed in gets into our lungs, bloodstream, and even our brain. 🧵1/
#iaq #wildfire #smoke #AQI #AQHI #Canada Bar chart of Canadian Air Quality Health Index (AQHI) - Equivalent # Cigarettes after Exposure ranging from 0.5 cigarettes after 8 hours exposure at AQHI level 3 to 0.9 cigarettes at level 6 and 1.5 at level 10.
Graph of Particulate Matter (PM) Levels in Ottawa from June 6, 2025 to June 8, 2025 from a VisiblAir Model X air quality sensor ( https://visiblair.com/ ).
The web version of this article with nice table of contents and easy to share with others can be found here ( tinyurl.com/AQHIwildfire ) and ( docs.google.com/document/d/1s9… ). 2/ Table of Contents: * Introduction * Air Quality Health Index (AQHI) * Health impact of Wildfire Smoke * Protect Yourself
When smoke stays in the air for prolonged periods of time, the UV radiation from the sun interacts with all the volatile organic compounds (VOCs) to form even more toxic gases ( ). 3/theweathernetwork.com/en/news/weathe…
Read 41 tweets
Jun 6, 2025
Pollution levels in Ottawa are very high from wildfire smoke. The particulate matter (PM)2.5 levels surpassed 140 ug/m^3 Thursday evening and are still above 130 on my VisiblAir Model X outdoor sensor ( ). 🧵1/ #iaq #wildfire #smoke visiblair.comLine graph showing PM2.5 levels in Ottawa increasing above 140 ug/m^3 and still above 130 now
Readings from a VisiblAir Model X outdoor air quality monitor showing levels in Ottawa above 130 ug/m^3 for PM2.5 wildfire smoke pollution
The EPA maps fine particulate pollution to their Air Quality Index where anything above 125.5 PM is Very Unhealthy which is a "Health alert: The risk of health effects is increased for everyone" ( ). 2/airnow.gov/aqi/aqi-basics/
EPA Categories:
* Unhealthy for Sensitive Groups (Orange) = 35.5-55.4 PM ug/m^3
* Unhealthy for everyone (Red) = 55.5 to 125.4 PM ug/m^3
* Very Unhealthy (Purple) = 125.5 to 225.4 PM ug/m^3
* Hazardous (Brown) = 225.5+ PM ug/m^3

3/
Read 13 tweets

Did Thread Reader help you today?

Support us! We are indie developers!


This site is made by just two indie developers on a laptop doing marketing, support and development! Read more about the story.

Become a Premium Member ($3/month or $30/year) and get exclusive features!

Become Premium

Don't want to be a Premium member but still want to support us?

Make a small donation by buying us coffee ($5) or help with server cost ($10)

Donate via Paypal

Or Donate anonymously using crypto!

Ethereum

0xfe58350B80634f60Fa6Dc149a72b4DFbc17D341E copy

Bitcoin

3ATGMxNzCUFzxpMCHL5sWSt4DVtS8UqXpi copy

Thank you for your support!

Follow Us!

:(