There are a lot of changes & new features coming to #rstats#tidycensus in April; you can try out the new features now with `remotes::install_github("walkerke/tidycensus")`. Read on in this thread to get up to speed on the updates: github.com/walkerke/tidyc…
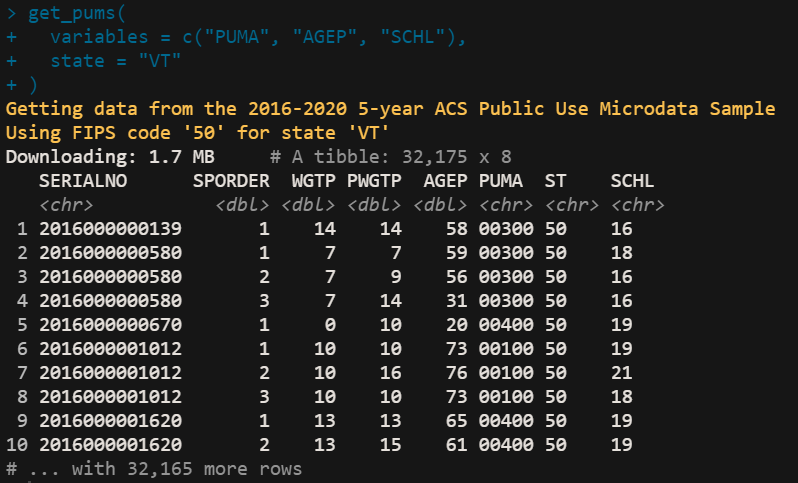
`get_acs()` and `get_pums()` now both default to the brand-new 5-year American Community Survey estimates. If you need other years, be sure to use the `year` argument to get data for that year
However, the 1-year ACS experimental estimates _are not_ available in tidycensus, and requesting them will throw an error. If you need 1-year ACS data, be sure to explicitly request data for a different year using the `year` argument
Analysts using the 5-year ACS detailed tables are commonly confused when variables come back as NA for a given geography. A new geography column in `load_variables()` output tells you the smallest geography at which a given variable is available!
`get_acs()` also now supports the ACS Comparison Profile, which is great for time-series analysis and making appropriate (e.g. inflation-adjusted) comparisons. Look up variable codes for 2016-2020 with `load_variables(2020, "acs5/cprofile")`
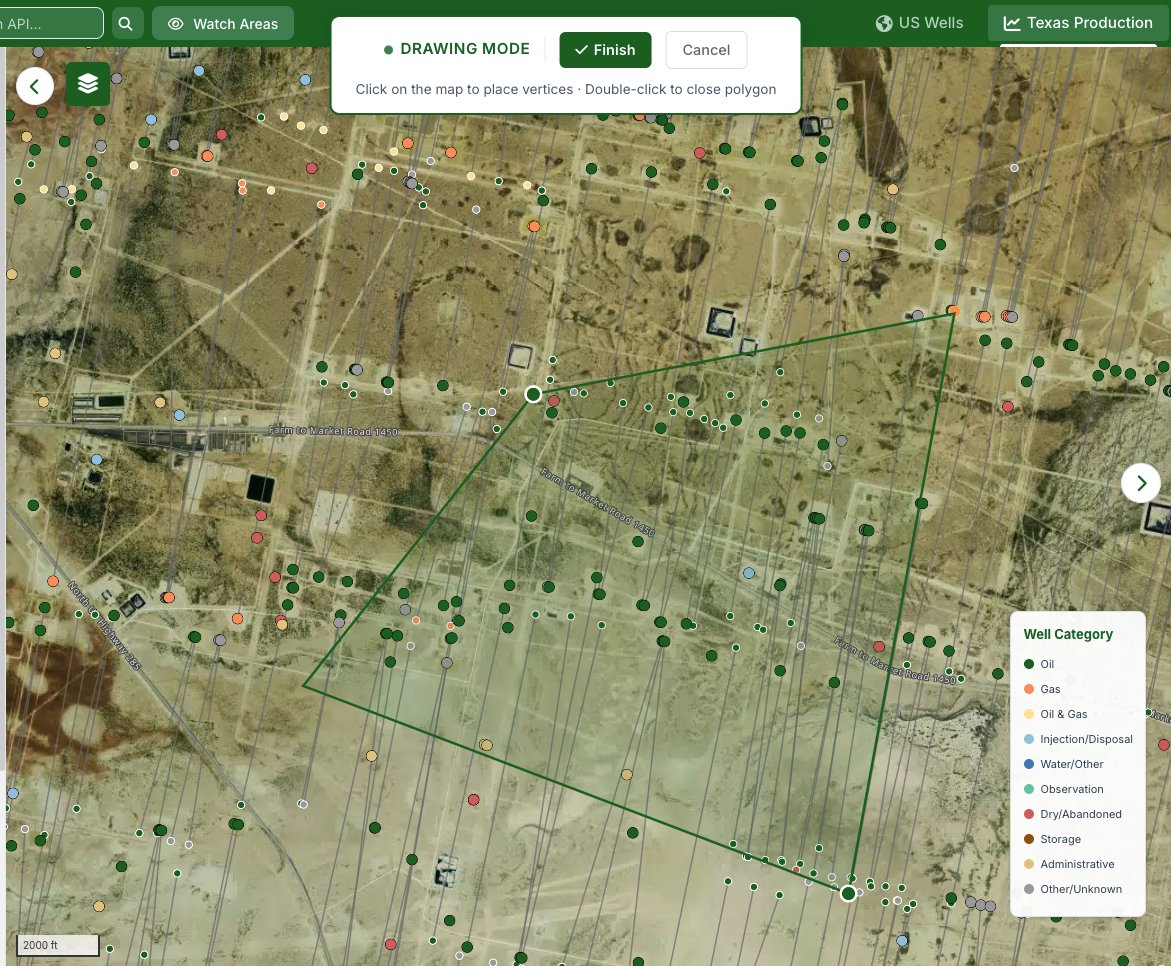
I've tweeted this before, but it's worth repeating: the new `as_dot_density()` function makes data prep for dot-density maps a breeze. Try modifying the example in the docs (?tidycensus::as_dot_density) for a location of your choice, and try out the dasymetric option too!
I'm in the process of integrating all of these updates into my book "Analyzing US Census Data" (walker-data.com/census-r/) so keep an eye out there for full documentation. These updates should be on CRAN sometime in April.
• • •
Missing some Tweet in this thread? You can try to
force a refresh
Isochrones show you the reachable area from a location for a given travel mode.
In #rstats, creating isochrones with @Mapbox
web services is easier than you think.
A 🧵 on getting started with isochrones using Mapbox and R:
In the mapboxapi R package, the function `mb_isochrone()` helps you calculate isochrones with some extra features to make your life easier.
For example, `mb_isochrone()` is integrated with Mapbox's geocoder so you can create isochrones directly from addresses
Alternatively, if you have an sf POINT object you can calculate isochrones in bulk over each location. Use the `id_column` argument to associate your isochrones with your input points
The latest release of Quarto integrates "lightbox" functionality for images with the option `lightbox: true`. Click to highlight your image for the audience:
The option `code-line-numbers` allows you to incrementally step through lines of code, which is excellent for programming walkthroughs.
The syntax `#| code-line-numbers: "|4|5"` allows me to step through tidycensus options incrementally as I present them!
Alternatively, if you want to grab the *data itself* from your basemap, use the function `get_vector_tiles()` to import the data right into your #rstats projects!
Want to do national analysis with the new 1-year ACS data? Counties won't work, as locations need at least 65,000 people to be included
Consider using Public Use Microdata Areas (PUMAs) instead! A thread about a Census geography that may be unfamiliar:
PUMAs are used as geographical identifiers for Census microdata. They are drawn after every decennial Census, and represent around 100,000-200,000 people at the beginning of a Census cycle walker-data.com/census-r/intro…
For states like Wyoming, PUMAs may cover multiple counties. In large cities, PUMAs often represent meaningful sub-city areas; for example, in NYC PUMAs are drawn to align with community districts