Demographics | Geospatial | Data Science | Open Source
Workshops: https://t.co/q3GDGnGshE
Book: https://t.co/r7xRJMViBx
Feb 5 • 6 tweets • 2 min read
Updates on US Census Data as of February 5:
According to the Census Bureau, all files on the public FTP server have been made publicly unavailable to comply with the President's executive orders.
They say they'll work to restore the files after they are reviewed and approved.
These inaccessible files include Census / ACS flat files, TIGER/Line shapefiles, and much of the data documentation / guidebooks on the website.
However: you CAN still access data via API as well as on .data.census.gov
Nov 12, 2024 • 7 tweets • 3 min read
I use #rstats to do #GIS every day because it is such a powerful connector of different tools and resources.
Read this 🧵 for a step-by-step workflow of how to do GIS operations with this made-up table of customer locations in R:
Our first step is to convert this table of X/Y coordinates into a "simple features" object with the sf R package.
We do this with the function `st_as_sf()`, making POINT geometries from the coordinates:
Apr 19, 2024 • 7 tweets • 3 min read
Isochrones show you the reachable area from a location for a given travel mode.
In #rstats, creating isochrones with @Mapbox
web services is easier than you think.
A 🧵 on getting started with isochrones using Mapbox and R:
In the mapboxapi R package, the function `mb_isochrone()` helps you calculate isochrones with some extra features to make your life easier.
For example, `mb_isochrone()` is integrated with Mapbox's geocoder so you can create isochrones directly from addresses
Feb 8, 2024 • 5 tweets • 2 min read
Today, I gave the first of three webinars in this year's @UMSSDAN Census Data in #rstats series:
I used @quarto_pub slides to build the deck, which has lots of amazing features!
A 🧵 on some of my favorites: walker-data.com/umich-workshop…
The latest release of Quarto integrates "lightbox" functionality for images with the option `lightbox: true`. Click to highlight your image for the audience:
Jan 19, 2024 • 7 tweets • 3 min read
I use #rstats to do #GIS every day because it is such a powerful connector of different tools and resources.
Read this 🧵 for a step-by-step workflow of how to do GIS operations with this made-up table of customer locations in R:
Our first step is to convert this table of X/Y coordinates into a "simple features" object with the sf R package.
We do this with the function `st_as_sf()`, making POINT geometries from the coordinates:
Oct 25, 2023 • 5 tweets • 2 min read
You already know that #tidycensus gets you pre-cleaned US Census data ready to analyze and map in #rstats.
But did you know it includes other features to make your data science projects easier?
Let's take a tour of a few features in this 🧵:
Dot-density maps are a staple in ArcGIS, but have traditionally been slow to produce in R
Use the function `as_dot_density()` to speed up this process, and for the US use the argument `erase_water` to avoid placing dots in water areas!
Oct 20, 2023 • 8 tweets • 4 min read
I just released a new version of the #rstats package {mapboxapi}, which helps you use @Mapbox web services in your data science projects.
Haven't used the package before? Let's take a tour!
A 🧵:
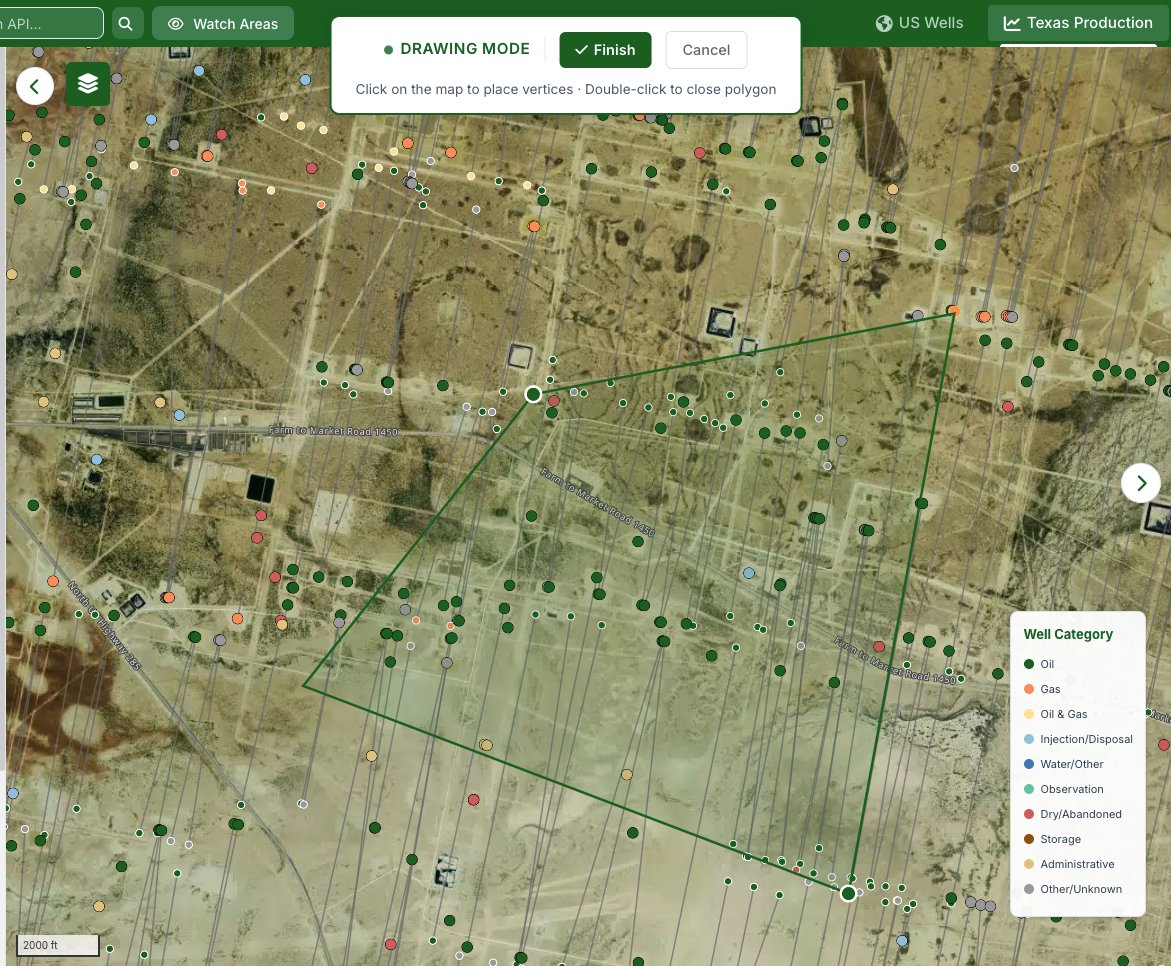
Mapbox's cartographic product Mapbox Studio lets you design completely custom basemap styles.
{mapboxapi} includes tools to help you use these styles in your Leaflet, ggplot2, and tmap maps
I use #rstats to do #GIS every day because it is such a powerful connector of different tools and resources.
Read this 🧵 for a step-by-step workflow of how to do GIS operations with this made-up table of customer locations in R:
Our first step is to convert this table of X/Y coordinates into a "simple features" object with the sf R package.
We do this with the function `st_as_sf()`, making POINT geometries from the coordinates:
Sep 16, 2022 • 4 tweets • 2 min read
Want to do national analysis with the new 1-year ACS data? Counties won't work, as locations need at least 65,000 people to be included
Consider using Public Use Microdata Areas (PUMAs) instead! A thread about a Census geography that may be unfamiliar:
PUMAs are used as geographical identifiers for Census microdata. They are drawn after every decennial Census, and represent around 100,000-200,000 people at the beginning of a Census cycle walker-data.com/census-r/intro…
Jul 6, 2022 • 5 tweets • 2 min read
A new version of my #rstats package crsuggest, which helps you with coordinate reference systems for your spatial data in R, was released on CRAN today. If you haven't tried the package / used it in a while, read on for a quick tour of its features: github.com/walkerke/crsug…
Using an appropriate projected coordinate reference system is important for both spatial analysis and cartographic display - but how do you pick one? The function `suggest_crs()` gives you CRS suggestions that could work well for your input data
Mar 31, 2022 • 7 tweets • 4 min read
There are a lot of changes & new features coming to #rstats#tidycensus in April; you can try out the new features now with `remotes::install_github("walkerke/tidycensus")`. Read on in this thread to get up to speed on the updates: github.com/walkerke/tidyc…
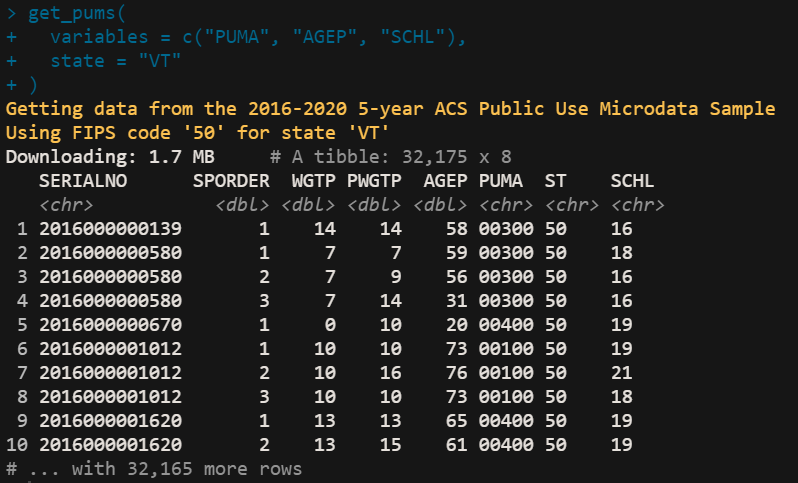
`get_acs()` and `get_pums()` now both default to the brand-new 5-year American Community Survey estimates. If you need other years, be sure to use the `year` argument to get data for that year