This thread further discussion of Worobey et al (2022), focusing on the title and abstract.
zenodo.org/record/6299116…
@MichaelWorobey @acritschristoph @K_G_Andersen @stuartjdneil @edwardcholmes @arambaut @carlzimmer @PeaseRoland @amymaxmen #OriginOfCovid
zenodo.org/record/6299116…
@MichaelWorobey @acritschristoph @K_G_Andersen @stuartjdneil @edwardcholmes @arambaut @carlzimmer @PeaseRoland @amymaxmen #OriginOfCovid
This thread builds on previous threads which discuss significant conceptual and methodological flaws in the spatial analysis of Worobey et al:
https://twitter.com/danwalker9999/status/1505769025967517696?s=20&t=HPm11UCys13VYDzAMwA2Bw
https://twitter.com/danwalker9999/status/1508921924566470658?s=20&t=IGMIeHi1SefBcfS9EHzKug
https://twitter.com/danwalker9999/status/1509337459938652160?s=20&t=UOt42y7mVVqMpl9t8YkRSA
https://twitter.com/danwalker9999/status/1511164215154774017?s=20&t=06BztYceMHQLZY36HjuoNw
Start with the title: “The Huanan market was the epicenter of SARS-CoV-2 emergence”. This reads more like a newspaper headline than the title of a scientific article. Perhaps unintentionally. 

This is not the typical coy title of a science article.
E.g., we see titles like “SARS-CoV-2 is associated with changes in brain structure in UK Biobank” rather than “SARS-CoV-2 causes brain damage”.
E.g., we see titles like “SARS-CoV-2 is associated with changes in brain structure in UK Biobank” rather than “SARS-CoV-2 causes brain damage”.
“Epicenter”, in the context of epidemiology, is used informally as a synonym for “hotspot”. It may be used as such in scientific articles (“The largest epicenter of the coronavirus outbreak in Vietnam”) and in headlines (“Europe Becomes COVID-19 Epicenter Again, WHO Says”.)
It has been re-purposed in the title to refer to the *origin* of the pandemic. It reappears in the last sentence of the abstract as “the unambiguous epicenter”, which is unfortunate, given that the term itself is not clearly defined in epidemiology.
The original scientific use of “epicenter” is in seismology; it refers to the point on earth’s surface directly above the subsurface origin point of an earthquake. Ironically, the seismic epicenter has nothing to do with the cause of the earthquake.
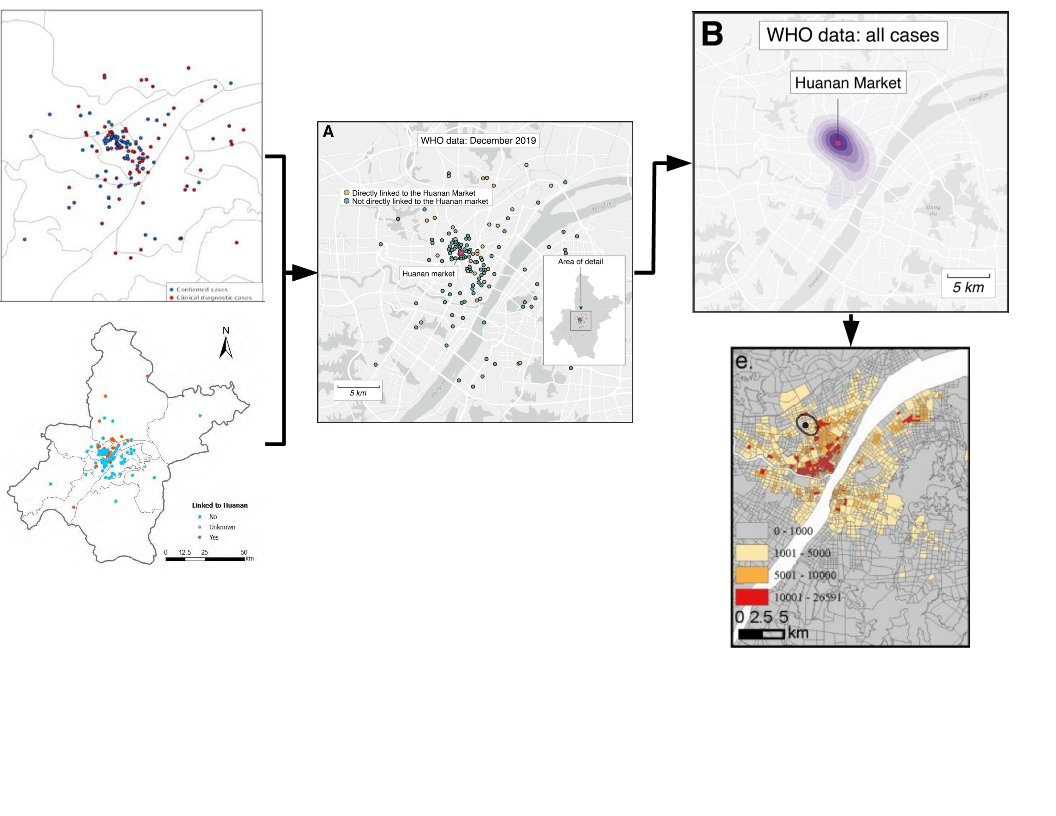
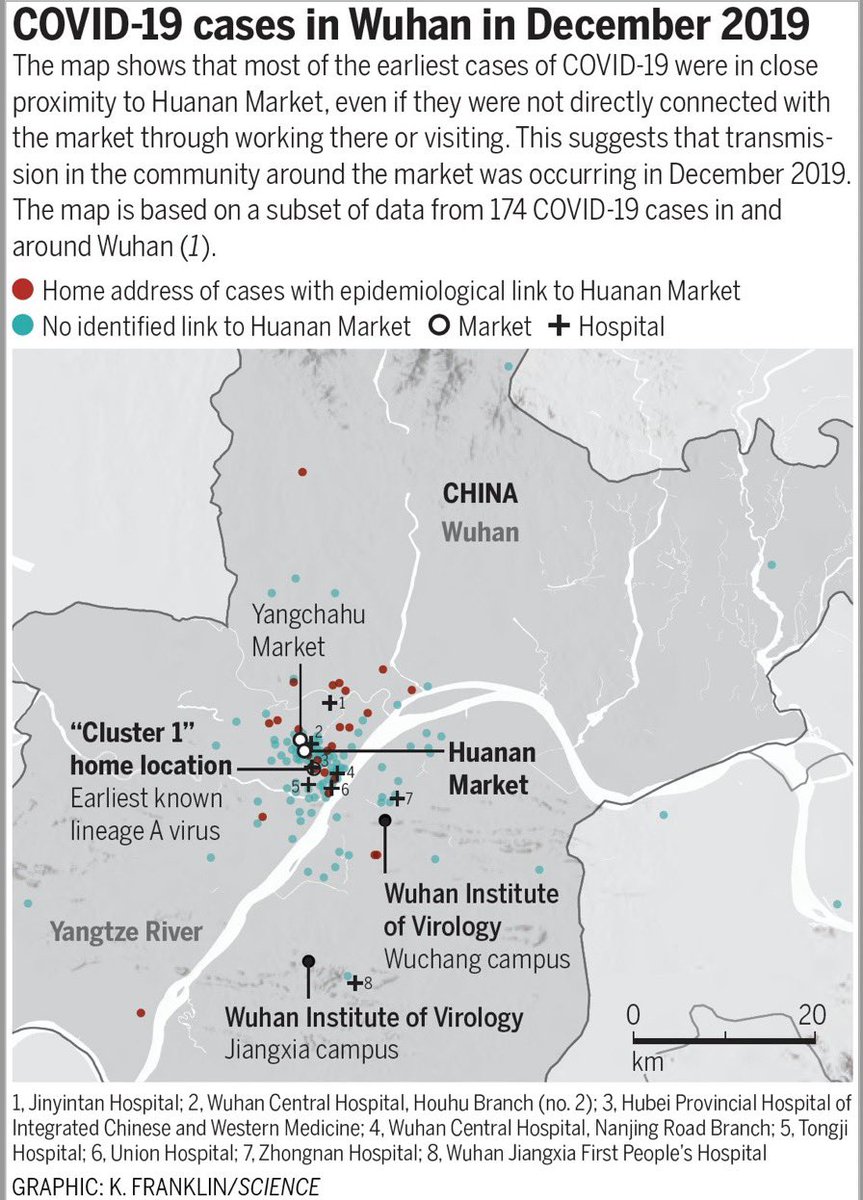
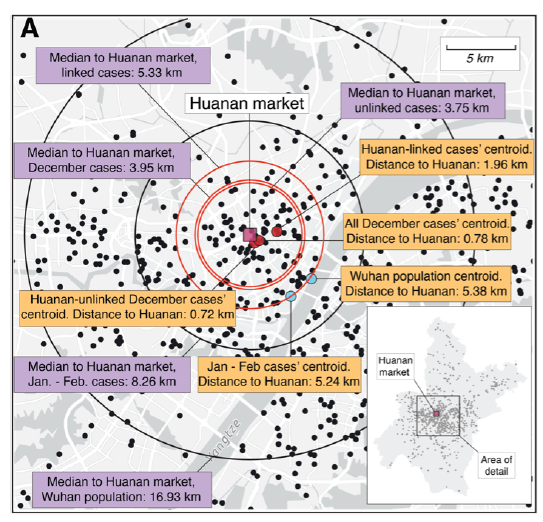
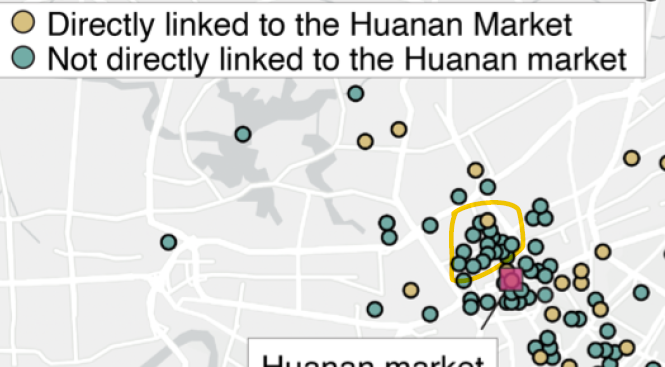
Fig 2A, with its concentric circles around the Huanan market, evokes an image of concentric circles of damage zones around the epicenter of an earthquake. This is presumably unintentional.
Abstract: 1st sentence: True. The role of the market remains controversial, because the observed facts of epidemiological links and presence of SARS-CoV-2-susceptible animals do not resolve the question of origin.
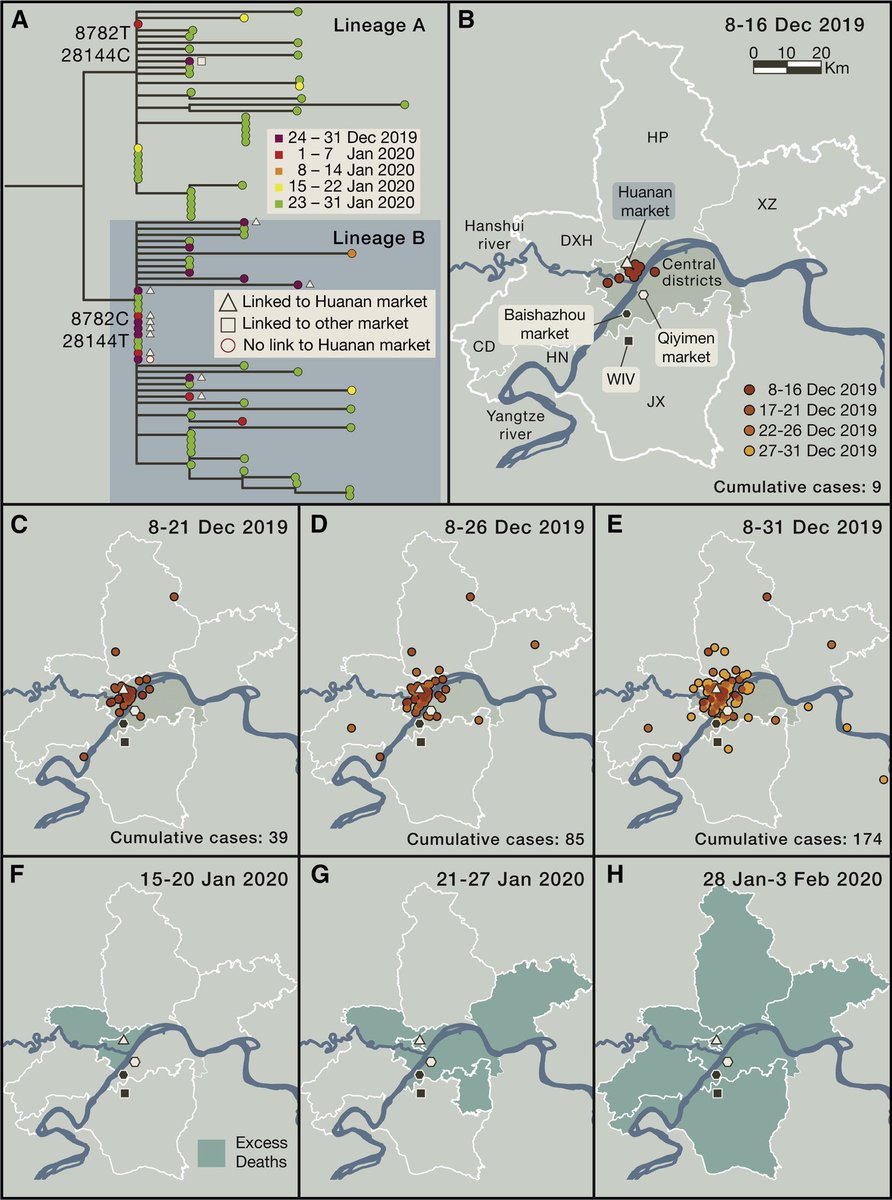
2nd sentence: The “spatial analyses” are deeply flawed, and show only that the authors do not understand how to manipulate and analyze spatial data. The claim of “centering” is based on a simplistic and incorrect assumption of human movement within a city.
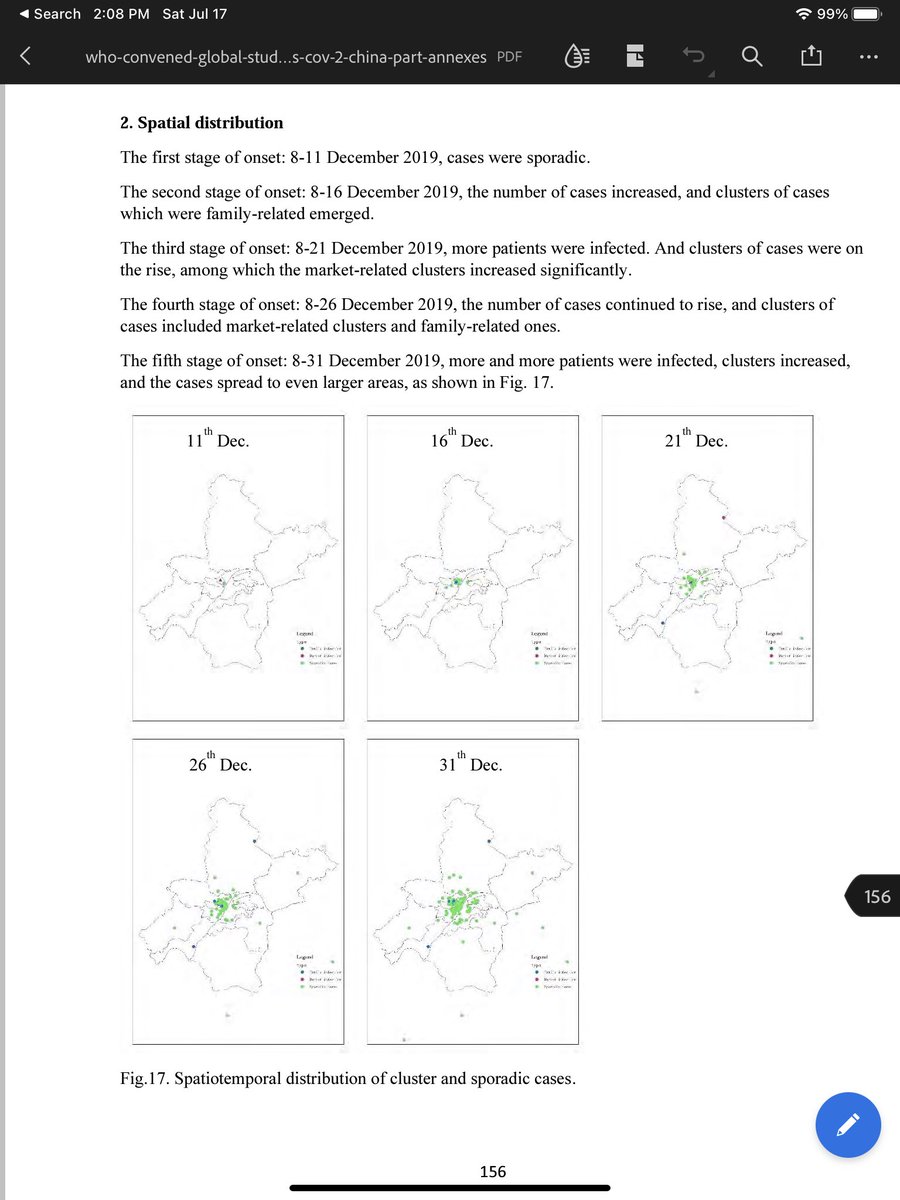
3rd sentence: The claim of no spatial correlation between the distribution of Dec-2019 case-residences and high population density of elders is invalid; it is based on a smoothing technique that effectively erases all local details, with further simplification for good measure.
3rd sentence: Consider, for example, the interesting area to the north of the market and the railway track. This area has a high density of both case-residences and elders. Fig 1a of Worobey et al:
4th sentence: This is correct. For most of the case-residences within 1-km radius of market, the patients specifically denied links with the market (Annex E of WHO report), and this is consistent with community transmission in the area surrounding the market...
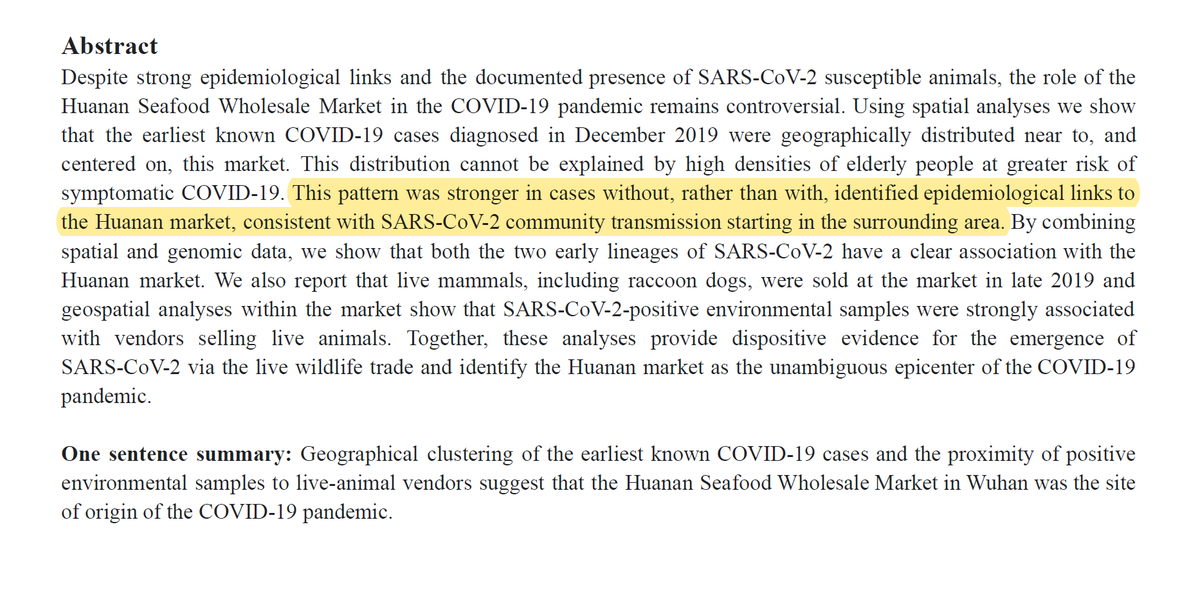
...which is consistent with multiple scenarios for the origin of COVID, including the scenario in which the Huanan market is simply an early location of community transmission, perhaps by virtue of its location in a neighbourhood with a high daily flux of commuters.
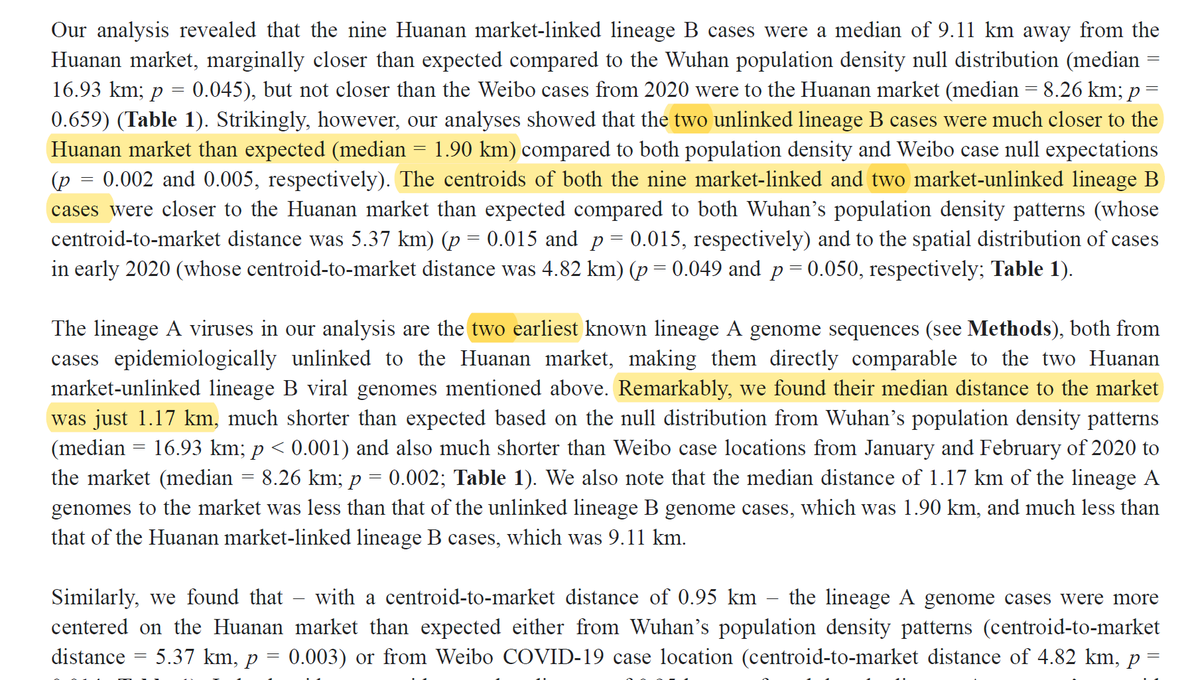
5th sentence: The “spatial analysis” relating lineages A and B to the market is based on an invalid concept of “centering”, which is not applicable to human movement in a large city. Also, the calculations of "centroid" and "median distance" are mathematically incorrect.
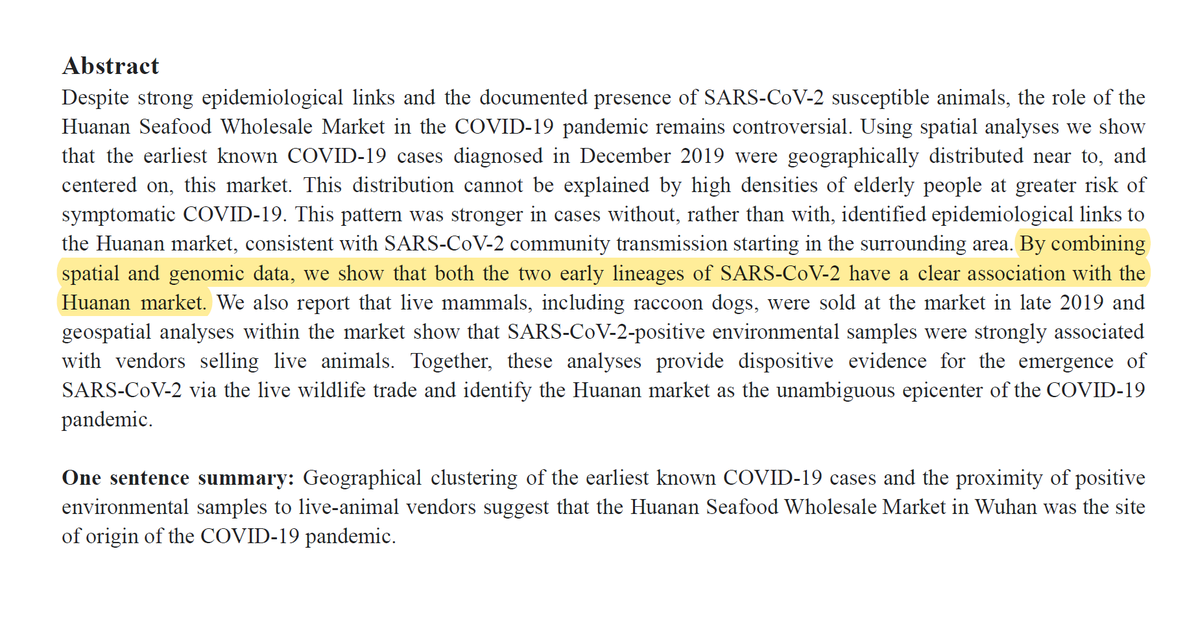
5th sentence: The “spatial analyses” for the A-lineage and B-lineage-unlinked-to-the-market are each based on the "centroid" or "median distance” of two (2) locations. I just typed that, and I had to go back and check. Yup. Two locations.
6th sentence: Correct. Presence of SARS-CoV-2-susceptible animals at the market in late 2019 is supported...
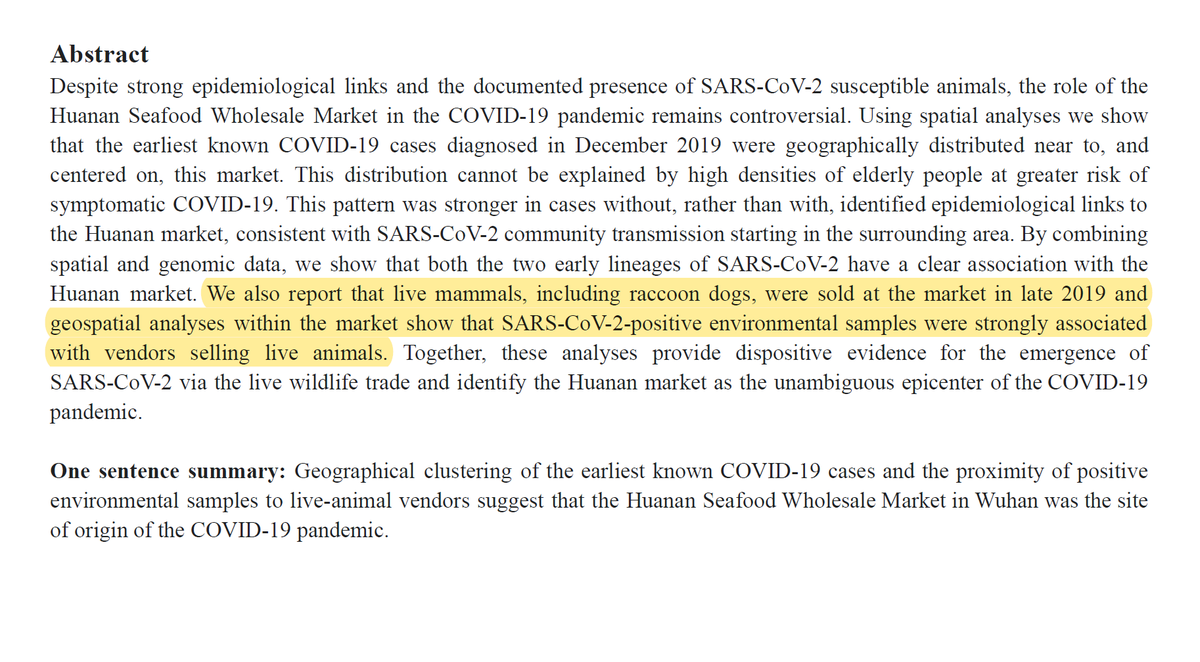
...co-author C. Newman, also co-author on Xiao et al (2021) would have further information beyond the simple Yes-No in Tables 2 and S3, including the number of each species sold in Huanan market in October and November 2019; and possibly specific stalls.
nature.com/articles/s4159…
nature.com/articles/s4159…
6th sentence: Correlation of SARS-COV-2-positive environmental samples with vendors selling live animals is supported. Evident from simple inspection of Fig 4A, Fig S16, Table S2; the “geospatial analyses” (Fig. 4B-D) are superfluous and simply obscure details.
6th sentence: So, the potential for animal-to-human transmission of SARS-CoV-2 in the market is supported by the data. Equally, the potential for human-to-animal transmission is supported. Remember the mink farms in Denmark.
7th sentence: The spatial analyses in this preprint are not conceptually valid, due to their dependence on the simplistic concept of “centering” to model the movement of humans and airborne disease in a large city with complex transport networks.
7th sentence: And then there are the methodological issues, including:
▪️mathematically-incorrect calculation of centroids;
▪️inaccurate plotting of case-residences
▪️ lat-long digitized as Cartesian distances
▪️using the wrong CRS
▪️undocumented shifting of locations
▪️mathematically-incorrect calculation of centroids;
▪️inaccurate plotting of case-residences
▪️ lat-long digitized as Cartesian distances
▪️using the wrong CRS
▪️undocumented shifting of locations
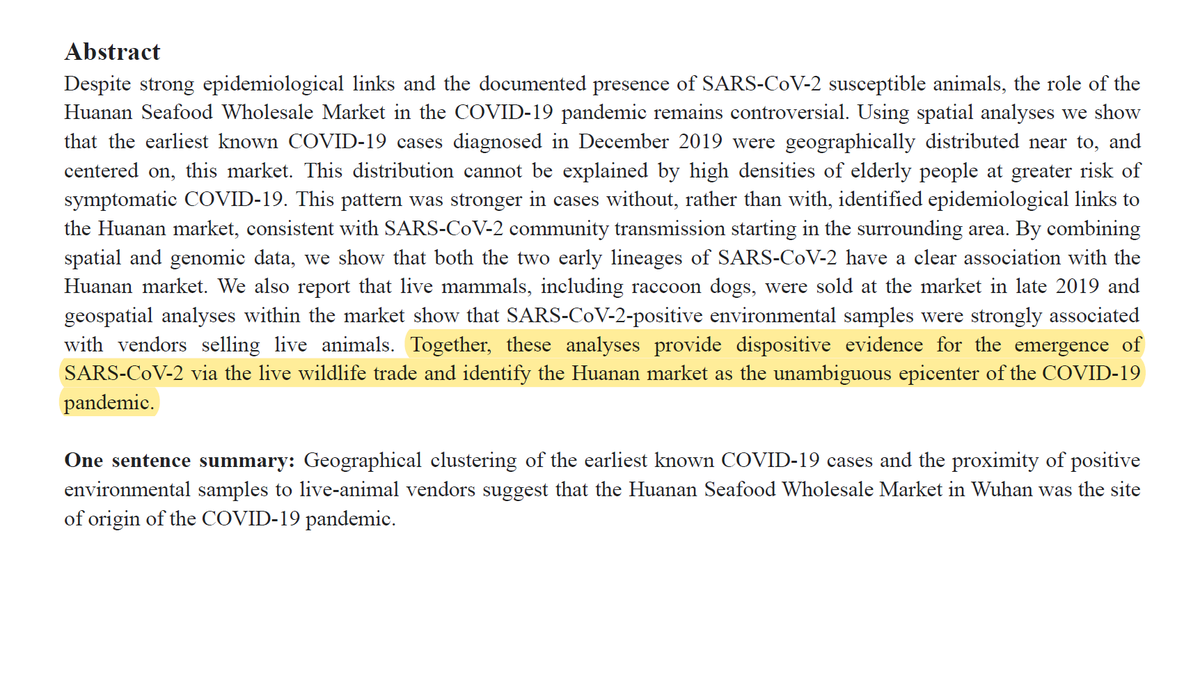
7th sentence: “dispositive” is a very strong word. It is a legal term that means “something that resolves a legal issue, claim or controversy”. In other words, case closed. It is rarely, if ever, used in science, because little in science can ever be described as resolved.
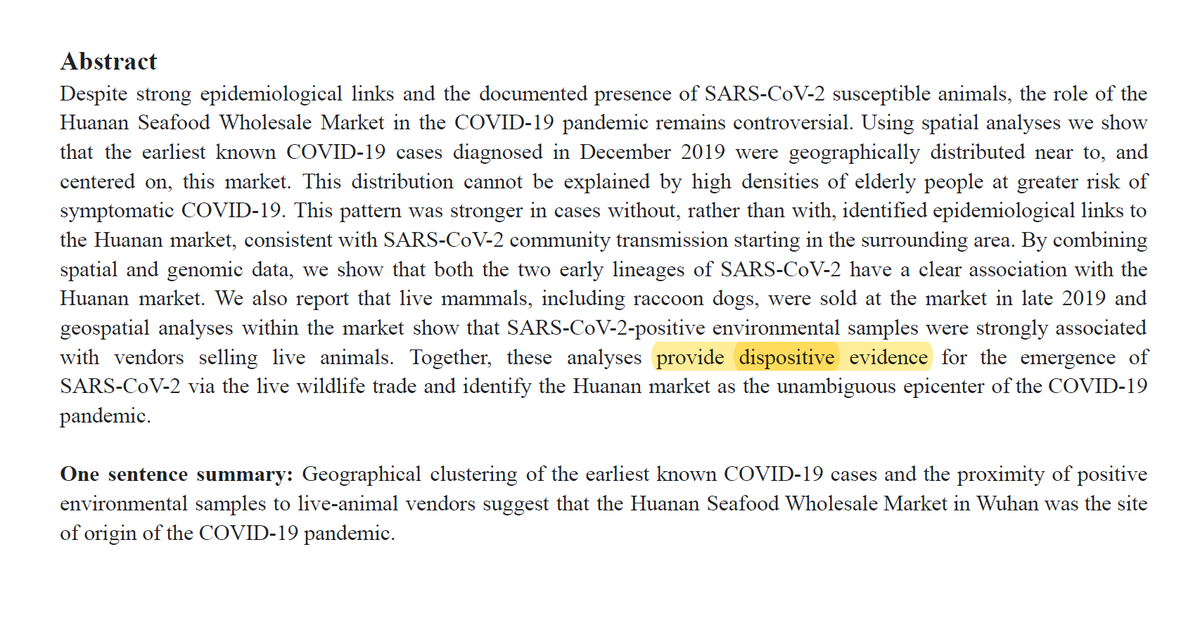
7th sentence: Considering that much of the preprint is invalidated due to the conceptual and methodological flaws in the spatial analysis, this preprint cannot be said to resolve the issue at all. It is obfuscation, rather than dispositive evidence.
I finally got an insult!
Not sure why it’s a screen shot, although I think that somehow makes the insult more devastating.
To be honest, though, what I was really hoping for was an argument.
Not sure why it’s a screen shot, although I think that somehow makes the insult more devastating.
To be honest, though, what I was really hoping for was an argument.
https://twitter.com/joshpowellphd/status/1513132334396104708
• • •
Missing some Tweet in this thread? You can try to
force a refresh